![]()
![]()
![]()
|
Mauritius |
Mean |
1970-2001 |
|||||||
|
1970-1979 |
1980-1989 |
1990-1995 |
1996-2001 |
Mean |
Min. |
Max. |
Variation (%) |
||
|
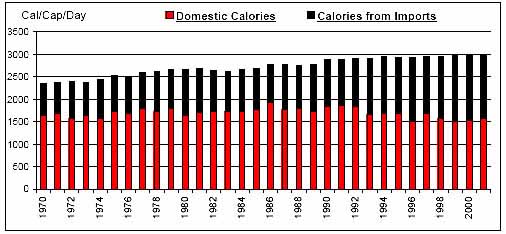
Per Caput Consumption (Cal/Day) |
2484 |
2701 |
2913 |
2965 |
2723 |
2356 |
2995 |
8 |
|
|
Imports / Consumption (%) |
Wheat |
100.00 |
100.00 |
100.00 |
100.00 |
100.00 |
100.00 |
100.00 |
0 |
|
Coarse Grains |
79.49 |
85.27 |
95.59 |
99.34 |
88.04 |
46.25 |
99.69 |
15 |
|
|
Rice |
99.07 |
99.86 |
99.99 |
100.00 |
99.66 |
98.04 |
100.00 |
1 |
|
|
Dairy |
68.87 |
89.46 |
91.75 |
95.69 |
84.62 |
58.98 |
96.54 |
15 |
|
|
Meat |
47.39 |
45.60 |
46.05 |
39.66 |
45.13 |
31.54 |
63.56 |
16 |
|
|
Sugar |
0.00 |
0.00 |
0.07 |
0.68 |
0.14 |
0.00 |
0.97 |
203 |
|
|
Fruits and Vegetables |
34.29 |
36.13 |
37.21 |
36.86 |
35.89 |
24.21 |
49.58 |
16 |
|
|
Oils |
70.41 |
82.09 |
91.35 |
94.61 |
82.52 |
59.36 |
95.76 |
13 |
|
|
Per Caput Calories from Imports (Cal/Cap/Day) |
800 |
948 |
1151 |
1406 |
1026 |
689 |
1467 |
23 |
|
|
Aid + Commercial Food Import Bill (US$ 000) |
61,671 |
104,232 |
161,223 |
203,414 |
120,214 |
21,843 |
258,124 |
49 |
|
|
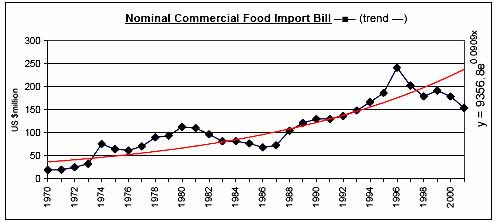
Commercial Food Import Bill (US$ 000) |
55,341 |
92,690 |
149,734 |
191,553 |
110,251 |
19,408 |
241,850 |
51 |
|
|
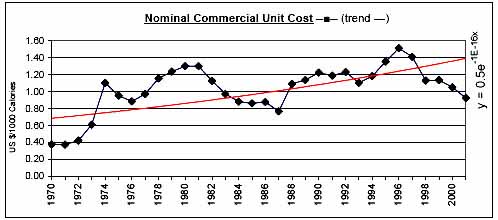
Commerical Unit Cost (US $/1000 calories) |
0.81 |
1.03 |
1.22 |
1.19 |
1.03 |
0.37 |
1.52 |
28 |
|
|
Commercial Food Import Bill / GDP (%) |
5.10 |
5.72 |
5.63 |
5.44 |
5.46 |
2.68 |
8.30 |
27 |
|
|
Comm. Fd. Imp. Bill / Total Merchandise Imp. Bill (%) |
19.90 |
14.36 |
8.60 |
8.72 |
13.95 |
7.15 |
25.68 |
42 |
|
|
Comm. Fd. Imp. Bill / Total Merchandise Exp. Bill (%) |
24.65 |
18.58 |
11.36 |
11.42 |
17.78 |
8.11 |
33.28 |
41 |
|
|
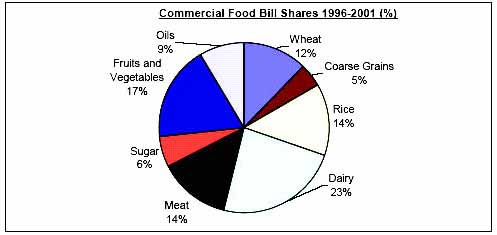
Commercial Food Value Bill Shares (%) |
Wheat |
14.73 |
16.32 |
11.12 |
12.13 |
14.07 |
8.81 |
21.49 |
21 |
|
Coarse Grains |
1.54 |
3.68 |
4.16 |
4.53 |
3.26 |
0.44 |
5.56 |
45 |
|
|
Rice |
33.23 |
21.49 |
15.12 |
13.62 |
22.49 |
0.00 |
52.56 |
46 |
|
|
Dairy |
15.67 |
21.65 |
26.27 |
23.51 |
21.00 |
11.03 |
27.92 |
22 |
|
|
Meat |
9.51 |
11.93 |
16.07 |
13.78 |
12.30 |
5.08 |
19.55 |
31 |
|
|
Sugar |
0.02 |
0.00 |
0.82 |
5.80 |
1.25 |
0.00 |
7.49 |
196 |
|
|
Fruits and Vegetables |
12.45 |
13.66 |
17.10 |
18.12 |
14.76 |
6.60 |
19.78 |
22 |
|
|
Oils |
12.84 |
11.28 |
9.34 |
8.50 |
10.88 |
7.25 |
20.51 |
25 |
|
|
|
|
|
|
|
|
|
|
![]()
![]()
![]()