![]()
![]()
![]()
|
Morocco |
Mean |
1970-2001 |
|||||||
|
1970-1979 |
1980-1989 |
1990-1995 |
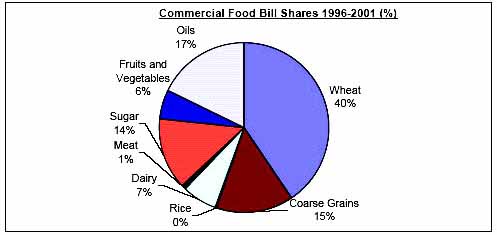
1996-2001 |
Mean |
Min. |
Max. |
Variation (%) |
||
|
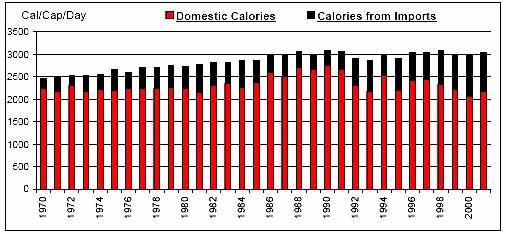
Per Caput Consumption (Cal/Day) |
2596 |
2893 |
2966 |
3025 |
2839 |
2469 |
3089 |
7 |
|
|
Imports / Consumption (%) |
Wheat |
35.44 |
43.60 |
44.16 |
48.35 |
42.05 |
17.73 |
72.32 |
38 |
|
Coarse Grains |
2.51 |
9.03 |
26.69 |
43.94 |
16.85 |
0.00 |
74.54 |
121 |
|
|
Rice |
0.04 |
31.83 |
27.39 |
9.81 |
16.93 |
0.00 |
93.06 |
169 |
|
|
Dairy |
20.62 |
19.24 |
22.76 |
18.27 |
20.15 |
12.88 |
31.01 |
18 |
|
|
Meat |
0.69 |
1.57 |
1.52 |
1.08 |
1.20 |
0.03 |
2.24 |
55 |
|
|
Sugar |
13.66 |
8.13 |
8.82 |
11.76 |
10.67 |
5.88 |
19.69 |
33 |
|
|
Fruits and Vegetables |
1.91 |
0.84 |
1.89 |
1.91 |
1.57 |
0.62 |
3.41 |
48 |
|
|
Oils |
30.05 |
30.92 |
32.52 |
43.14 |
33.24 |
14.23 |
53.19 |
28 |
|
|
Per Caput Calories from Imports (Cal/Cap/Day) |
366 |
481 |
530 |
748 |
504 |
220 |
895 |
34 |
|
|
Aid + Commercial Food Import Bill (US$ 000) |
379,319 |
601,263 |
809,283 |
1,187,280 |
680,787 |
109,605 |
1,325,295 |
51 |
|
|
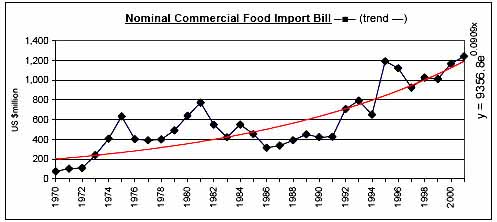
Commercial Food Import Bill (US$ 000) |
326,049 |
488,067 |
698,945 |
1,082,750 |
588,479 |
76,867 |
1,243,054 |
55 |
|
|
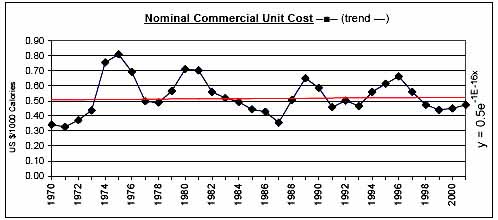
Commerical Unit Cost (US $/1000 calories) |
0.53 |
0.54 |
0.53 |
0.51 |
0.53 |
0.33 |
0.81 |
23 |
|
|
Commercial Food Import Bill / GDP (%) |
2.30 |
2.46 |
2.59 |
3.44 |
2.62 |
0.74 |
4.58 |
39 |
|
|
Comm. Fd. Imp. Bill / Total Merchandise Imp. Bill (%) |
16.20 |
11.55 |
9.46 |
10.69 |
12.45 |
6.09 |
24.71 |
34 |
|
|
Comm. Fd. Imp. Bill / Total Merchandise Exp. Bill (%) |
25.88 |
20.15 |
16.80 |
17.62 |
20.84 |
9.92 |
41.17 |
35 |
|
|
Commercial Food Value Bill Shares (%) |
Wheat |
34.69 |
44.92 |
36.20 |
40.50 |
39.26 |
7.19 |
58.82 |
25 |
|
Coarse Grains |
1.85 |
5.68 |
9.99 |
14.86 |
7.01 |
0.00 |
18.27 |
76 |
|
|
Rice |
0.00 |
0.24 |
0.40 |
0.18 |
0.18 |
0.00 |
1.16 |
191 |
|
|
Dairy |
10.04 |
10.29 |
12.35 |
6.59 |
9.91 |
5.36 |
18.30 |
35 |
|
|
Meat |
0.43 |
1.23 |
1.60 |
0.89 |
0.98 |
0.01 |
2.01 |
68 |
|
|
Sugar |
28.88 |
16.25 |
15.44 |
13.70 |
19.56 |
8.71 |
37.82 |
43 |
|
|
Fruits and Vegetables |
4.47 |
2.40 |
5.70 |
5.50 |
4.25 |
1.19 |
8.59 |
46 |
|
|
Oils |
19.64 |
18.99 |
18.33 |
17.78 |
18.84 |
11.02 |
30.89 |
25 |
|
|
|
|
|
|
|
|
|
|
![]()
![]()
![]()