![]()
![]()
![]()
|
Mozambique |
Mean |
1970-2001 |
|||||||
|
1970-1979 |
1980-1989 |
1990-1995 |
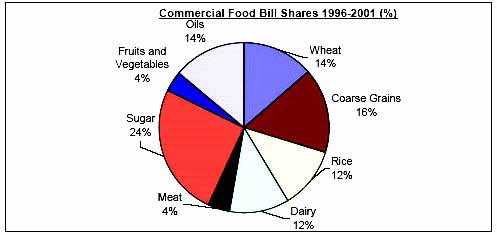
1996-2001 |
Mean |
Min. |
Max. |
Variation (%) |
||
|
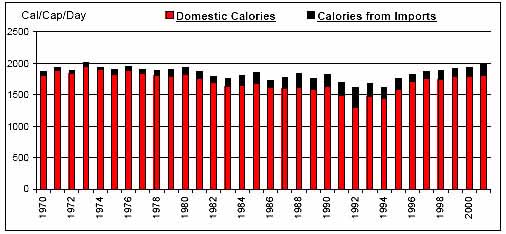
Per Caput Consumption (Cal/Day) |
1919 |
1811 |
1693 |
1904 |
1840 |
1609 |
2011 |
6 |
|
|
Imports / Consumption (%) |
Wheat |
93.57 |
95.56 |
98.50 |
99.27 |
96.18 |
86.50 |
99.57 |
3 |
|
Coarse Grains |
6.25 |
24.30 |
38.35 |
9.58 |
18.53 |
0.06 |
78.96 |
91 |
|
|
Rice |
22.63 |
47.97 |
50.67 |
21.81 |
35.65 |
0.00 |
70.91 |
60 |
|
|
Dairy |
29.59 |
37.76 |
38.19 |
36.67 |
35.08 |
21.95 |
62.54 |
29 |
|
|
Meat |
2.09 |
2.43 |
2.43 |
3.72 |
2.57 |
0.36 |
8.72 |
66 |
|
|
Sugar |
0.00 |
9.49 |
19.47 |
23.37 |
11.00 |
0.00 |
37.58 |
105 |
|
|
Fruits and Vegetables |
2.06 |
3.15 |
6.74 |
3.50 |
3.55 |
0.20 |
10.58 |
75 |
|
|
Oils |
1.43 |
4.34 |
7.21 |
6.49 |
4.37 |
0.30 |
13.41 |
73 |
|
|
Per Caput Calories from Imports (Cal/Cap/Day) |
67 |
147 |
204 |
137 |
131 |
30 |
303 |
46 |
|
|
Aid + Commercial Food Import Bill (US$ 000) |
41,667 |
139,019 |
211,108 |
170,561 |
128,027 |
20,119 |
266,469 |
55 |
|
|
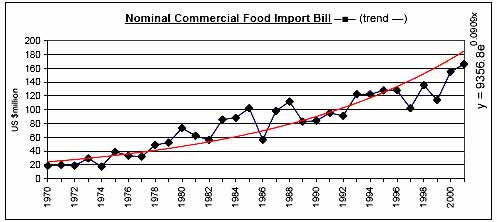
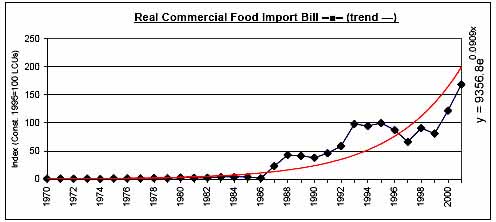
Commercial Food Import Bill (US$ 000) |
31,218 |
81,905 |
107,343 |
133,447 |
80,499 |
17,763 |
166,039 |
52 |
|
|
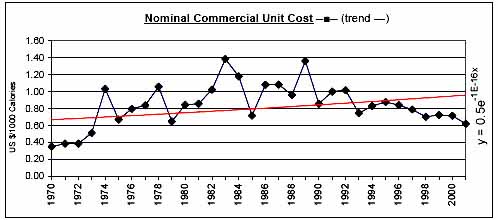
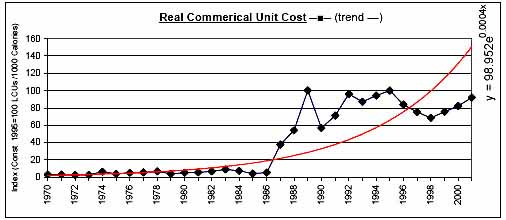
Commerical Unit Cost (US $/1000 calories) |
0.67 |
1.05 |
0.89 |
0.73 |
0.84 |
0.35 |
1.39 |
30 |
|
|
Commercial Food Import Bill / GDP (%) |
1.37 |
3.50 |
3.73 |
3.16 |
2.81 |
0.78 |
4.95 |
43 |
|
|
Comm. Fd. Imp. Bill / Total Merchandise Imp. Bill (%) |
8.16 |
12.95 |
12.01 |
13.54 |
11.39 |
3.84 |
24.21 |
37 |
|
|
Comm. Fd. Imp. Bill / Total Merchandise Exp. Bill (%) |
17.85 |
71.67 |
73.55 |
44.41 |
50.09 |
5.96 |
133.84 |
67 |
|
|
Commercial Food Value Bill Shares (%) |
Wheat |
23.08 |
7.99 |
17.51 |
13.64 |
15.55 |
0.00 |
44.92 |
79 |
|
Coarse Grains |
8.08 |
9.88 |
4.74 |
16.06 |
9.51 |
0.00 |
43.52 |
103 |
|
|
Rice |
21.15 |
30.68 |
23.82 |
11.66 |
22.85 |
0.00 |
62.26 |
74 |
|
|
Dairy |
16.51 |
12.41 |
13.50 |
11.56 |
13.74 |
4.92 |
25.43 |
35 |
|
|
Meat |
4.85 |
5.22 |
3.56 |
4.05 |
4.57 |
0.82 |
14.15 |
62 |
|
|
Sugar |
0.03 |
10.78 |
13.45 |
25.26 |
10.64 |
0.00 |
41.59 |
107 |
|
|
Fruits and Vegetables |
12.59 |
7.83 |
4.01 |
3.93 |
7.87 |
0.08 |
24.83 |
96 |
|
|
Oils |
13.72 |
15.21 |
19.41 |
13.86 |
15.28 |
4.00 |
38.20 |
44 |
|
|
|
|
|
|
|
|
|
|
![]()
![]()
![]()