![]()
![]()
![]()
|
Myanmar |
Mean |
1970-2001 |
|||||||
|
1970-1979 |
1980-1989 |
1990-1995 |
1996-2001 |
Mean |
Min. |
Max. |
Variation (%) |
||
|
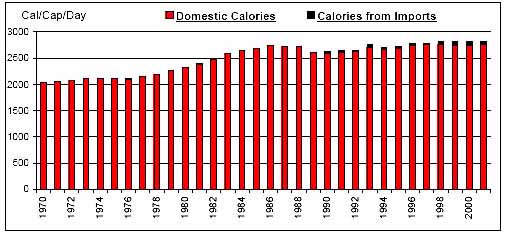
Per Caput Consumption (Cal/Day) |
2122 |
2592 |
2682 |
2799 |
2501 |
2039 |
2822 |
11 |
|
|
Imports / Consumption (%) |
Wheat |
28.78 |
2.90 |
14.04 |
44.03 |
20.79 |
0.00 |
53.60 |
99 |
|
Coarse Grains |
0.12 |
N/A |
0.00 |
0.40 |
0.11 |
0.00 |
1.18 |
259 |
|
|
Rice |
0.00 |
N/A |
N/A |
0.03 |
0.00 |
0.00 |
0.06 |
287 |
|
|
Dairy |
12.70 |
3.93 |
9.49 |
15.15 |
9.82 |
1.17 |
24.22 |
60 |
|
|
Meat |
0.00 |
N/A |
0.02 |
0.07 |
0.02 |
0.00 |
0.18 |
229 |
|
|
Sugar |
0.01 |
0.00 |
0.20 |
0.36 |
0.11 |
0.00 |
0.93 |
189 |
|
|
Fruits and Vegetables |
0.02 |
0.02 |
0.02 |
0.55 |
0.12 |
0.00 |
0.99 |
218 |
|
|
Oils |
1.72 |
2.23 |
12.67 |
11.54 |
5.77 |
0.22 |
15.44 |
93 |
|
|
Per Caput Calories from Imports (Cal/Cap/Day) |
7 |
7 |
39 |
52 |
21 |
2 |
66 |
99 |
|
|
Aid + Commercial Food Import Bill (US$ 000) |
15,701 |
23,811 |
130,111 |
188,191 |
72,029 |
8,477 |
273,372 |
111 |
|
|
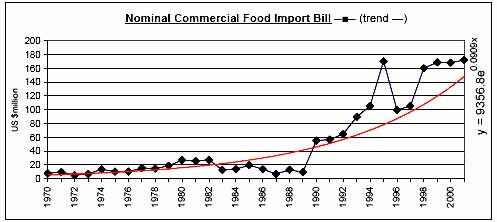
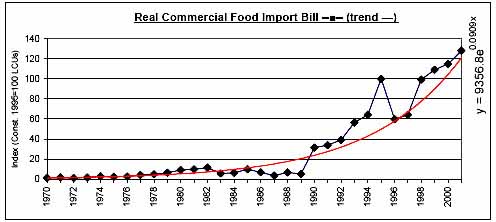
Commercial Food Import Bill (US$ 000) |
11,397 |
17,100 |
90,455 |
145,665 |
53,178 |
5,423 |
171,915 |
110 |
|
|
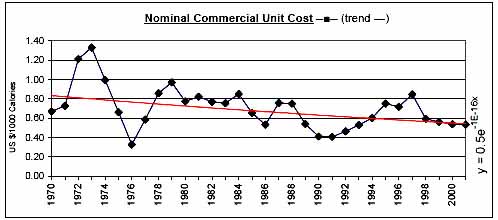
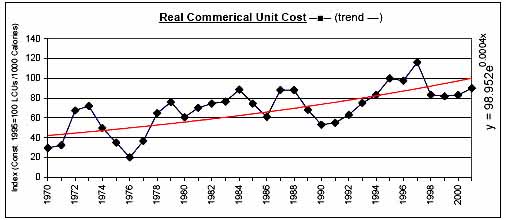
Commerical Unit Cost (US $/1000 calories) |
0.83 |
0.72 |
0.53 |
0.63 |
0.70 |
0.33 |
1.33 |
31 |
|
|
Commercial Food Import Bill / GDP (%) |
0.60 |
0.62 |
2.77 |
3.13 |
1.49 |
0.25 |
4.62 |
84 |
|
|
Comm. Fd. Imp. Bill / Total Merchandise Imp. Bill (%) |
4.91 |
3.03 |
7.36 |
6.08 |
5.00 |
1.16 |
9.39 |
41 |
|
|
Comm. Fd. Imp. Bill / Total Merchandise Exp. Bill (%) |
5.78 |
4.43 |
13.08 |
11.80 |
7.85 |
2.25 |
19.22 |
54 |
|
|
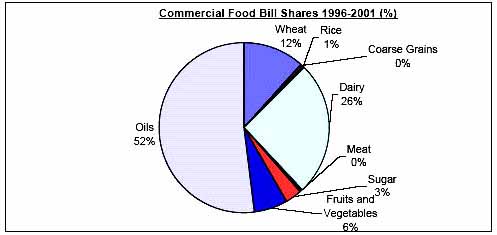
Commercial Food Value Bill Shares (%) |
Wheat |
9.03 |
0.96 |
4.68 |
11.80 |
6.21 |
0.00 |
24.15 |
118 |
|
Coarse Grains |
0.17 |
N/A |
0.00 |
0.31 |
0.11 |
0.00 |
1.64 |
294 |
|
|
Rice |
0.00 |
N/A |
N/A |
0.51 |
0.10 |
0.00 |
1.59 |
370 |
|
|
Dairy |
54.75 |
42.17 |
22.09 |
25.51 |
39.21 |
15.04 |
70.50 |
41 |
|
|
Meat |
0.05 |
N/A |
0.12 |
0.48 |
0.13 |
0.00 |
1.16 |
213 |
|
|
Sugar |
0.20 |
0.05 |
2.05 |
2.93 |
1.01 |
0.00 |
6.16 |
165 |
|
|
Fruits and Vegetables |
1.36 |
0.13 |
0.12 |
6.44 |
1.70 |
0.00 |
8.55 |
152 |
|
|
Oils |
34.44 |
56.69 |
70.94 |
52.03 |
51.53 |
11.47 |
80.37 |
34 |
|
|
|
|
|
|
|
|
|
|
![]()
![]()
![]()