![]()
![]()
![]()
|
Nepal |
Mean |
1970-2001 |
|||||||
|
1970-1979 |
1980-1989 |
1990-1995 |
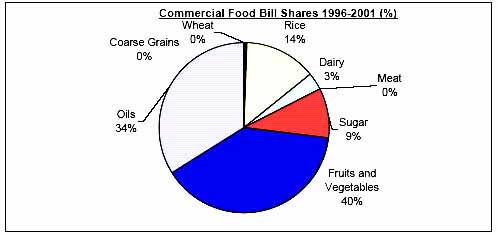
1996-2001 |
Mean |
Min. |
Max. |
Variation (%) |
||
|
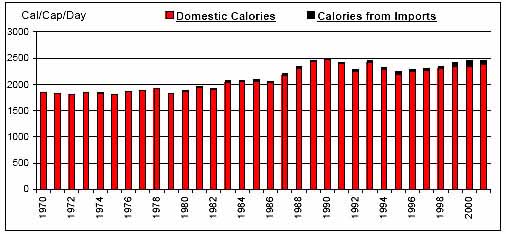
Per Caput Consumption (Cal/Day) |
1845 |
2107 |
2368 |
2376 |
2125 |
1803 |
2494 |
12 |
|
|
Imports / Consumption (%) |
Wheat |
0.98 |
4.84 |
0.81 |
0.79 |
2.12 |
0.00 |
11.36 |
139 |
|
Coarse Grains |
0.01 |
0.16 |
0.02 |
0.16 |
0.09 |
0.00 |
1.01 |
249 |
|
|
Rice |
N/A |
0.63 |
0.94 |
1.62 |
0.68 |
0.00 |
4.61 |
138 |
|
|
Dairy |
0.58 |
2.54 |
1.13 |
1.00 |
1.37 |
0.00 |
5.20 |
89 |
|
|
Meat |
N/A |
0.01 |
0.01 |
0.02 |
0.01 |
0.00 |
0.05 |
221 |
|
|
Sugar |
2.14 |
3.18 |
1.70 |
2.28 |
2.41 |
0.00 |
9.61 |
82 |
|
|
Fruits and Vegetables |
0.08 |
3.78 |
2.16 |
3.16 |
2.21 |
0.00 |
6.19 |
99 |
|
|
Oils |
0.22 |
11.51 |
23.31 |
31.94 |
14.03 |
0.00 |
44.44 |
95 |
|
|
Per Caput Calories from Imports (Cal/Cap/Day) |
3 |
29 |
37 |
64 |
29 |
0 |
107 |
91 |
|
|
Aid + Commercial Food Import Bill (US$ 000) |
2,779 |
37,827 |
62,351 |
140,297 |
50,686 |
110 |
233,427 |
108 |
|
|
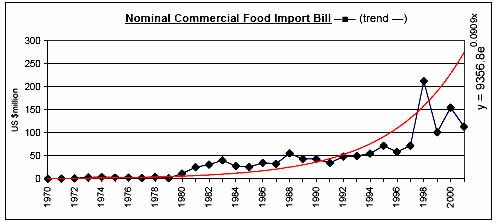
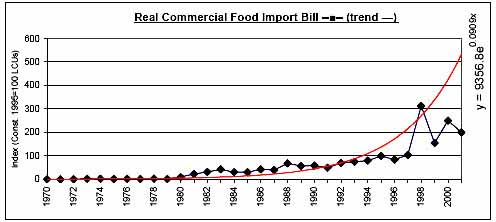
Commercial Food Import Bill (US$ 000) |
2,241 |
32,714 |
50,373 |
118,818 |
42,647 |
20 |
212,526 |
112 |
|
|
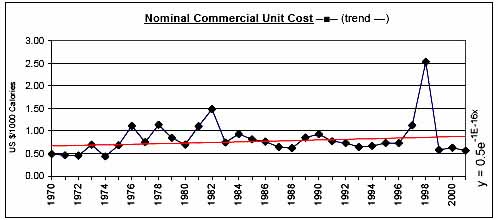
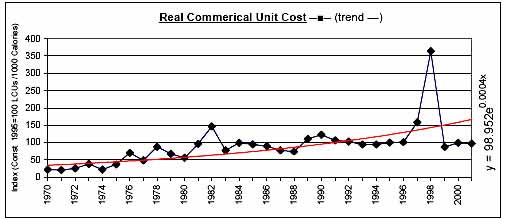
Commerical Unit Cost (US $/1000 calories) |
0.71 |
0.87 |
0.75 |
1.03 |
0.83 |
0.44 |
2.54 |
47 |
|
|
Commercial Food Import Bill / GDP (%) |
0.11 |
1.21 |
1.25 |
2.29 |
1.07 |
0.00 |
4.25 |
85 |
|
|
Comm. Fd. Imp. Bill / Total Merchandise Imp. Bill (%) |
1.67 |
7.09 |
5.99 |
8.39 |
5.44 |
0.02 |
15.74 |
62 |
|
|
Comm. Fd. Imp. Bill / Total Merchandise Exp. Bill (%) |
2.55 |
24.50 |
16.76 |
23.70 |
16.04 |
0.04 |
50.92 |
79 |
|
|
Commercial Food Value Bill Shares (%) |
Wheat |
6.13 |
15.37 |
2.22 |
0.32 |
7.19 |
0.00 |
61.29 |
208 |
|
Coarse Grains |
N/A |
0.64 |
0.06 |
0.34 |
0.28 |
0.00 |
2.69 |
235 |
|
|
Rice |
N/A |
14.88 |
10.44 |
13.53 |
9.14 |
0.00 |
33.56 |
118 |
|
|
Dairy |
23.92 |
12.66 |
9.13 |
3.33 |
13.77 |
0.00 |
70.63 |
125 |
|
|
Meat |
N/A |
0.05 |
0.04 |
0.09 |
0.04 |
0.00 |
0.28 |
216 |
|
|
Sugar |
62.72 |
13.98 |
12.79 |
9.48 |
28.14 |
0.00 |
100.00 |
113 |
|
|
Fruits and Vegetables |
3.28 |
23.80 |
26.74 |
39.12 |
20.81 |
0.00 |
82.12 |
87 |
|
|
Oils |
3.95 |
18.62 |
38.56 |
33.81 |
20.62 |
0.00 |
50.20 |
78 |
|
|
|
|
|
|
|
|
|
|
![]()
![]()
![]()