![]()
![]()
![]()
|
Niger |
Mean |
1970-2001 |
|||||||
|
1970-1979 |
1980-1989 |
1990-1995 |
1996-2001 |
Mean |
Min. |
Max. |
Variation (%) |
||
|
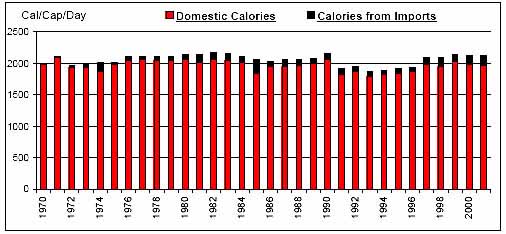
Per Caput Consumption (Cal/Day) |
2052 |
2100 |
1950 |
2086 |
2054 |
1877 |
2169 |
4 |
|
|
Imports / Consumption (%) |
Wheat |
87.11 |
87.78 |
86.64 |
81.72 |
86.22 |
64.57 |
97.39 |
12 |
|
Coarse Grains |
2.86 |
3.51 |
1.25 |
2.99 |
2.79 |
0.08 |
12.01 |
100 |
|
|
Rice |
12.57 |
38.92 |
37.46 |
59.32 |
34.24 |
0.11 |
67.90 |
62 |
|
|
Dairy |
5.52 |
13.80 |
7.40 |
9.95 |
9.29 |
1.01 |
28.46 |
67 |
|
|
Meat |
0.55 |
0.65 |
0.27 |
0.12 |
0.45 |
0.02 |
3.40 |
143 |
|
|
Sugar |
10.24 |
19.50 |
26.91 |
25.26 |
19.08 |
2.34 |
38.83 |
50 |
|
|
Fruits and Vegetables |
4.82 |
7.16 |
4.04 |
6.76 |
5.77 |
0.77 |
10.71 |
44 |
|
|
Oils |
3.82 |
16.06 |
25.13 |
20.64 |
14.80 |
0.52 |
48.16 |
74 |
|
|
Per Caput Calories from Imports (Cal/Cap/Day) |
52 |
110 |
83 |
120 |
89 |
16 |
225 |
48 |
|
|
Aid + Commercial Food Import Bill (US$ 000) |
21,971 |
75,644 |
79,355 |
100,319 |
64,193 |
4,773 |
122,831 |
52 |
|
|
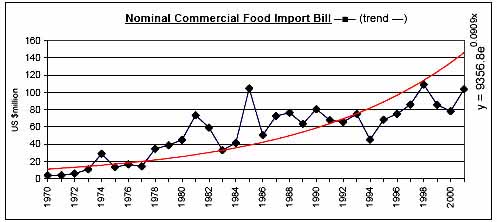
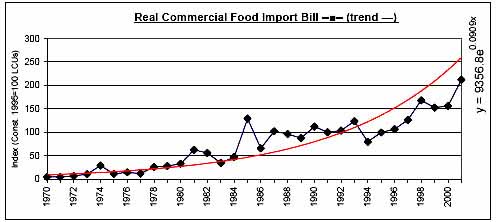
Commercial Food Import Bill (US$ 000) |
17,308 |
62,185 |
67,263 |
89,728 |
54,278 |
4,050 |
109,283 |
57 |
|
|
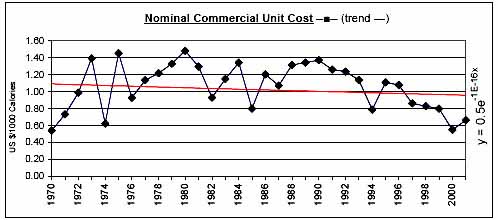
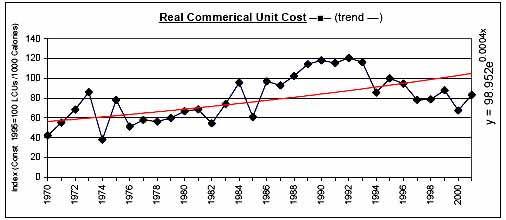
Commerical Unit Cost (US $/1000 calories) |
1.03 |
1.19 |
1.15 |
0.80 |
1.06 |
0.54 |
1.48 |
26 |
|
|
Commercial Food Import Bill / GDP (%) |
0.97 |
2.61 |
2.69 |
3.05 |
2.19 |
0.25 |
4.76 |
49 |
|
|
Comm. Fd. Imp. Bill / Total Merchandise Imp. Bill (%) |
12.06 |
15.78 |
16.69 |
22.91 |
16.12 |
6.94 |
30.19 |
42 |
|
|
Comm. Fd. Imp. Bill / Total Merchandise Exp. Bill (%) |
16.36 |
19.51 |
24.24 |
32.36 |
21.82 |
7.82 |
55.36 |
51 |
|
|
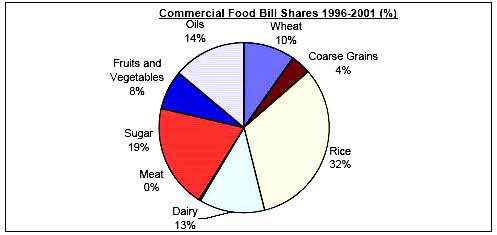
Commercial Food Value Bill Shares (%) |
Wheat |
6.96 |
9.57 |
14.70 |
9.59 |
9.72 |
0.00 |
21.79 |
66 |
|
Coarse Grains |
12.59 |
11.19 |
2.33 |
4.01 |
8.62 |
0.00 |
53.90 |
168 |
|
|
Rice |
7.37 |
23.77 |
23.46 |
32.51 |
20.23 |
0.04 |
46.68 |
63 |
|
|
Dairy |
15.57 |
11.26 |
10.30 |
12.64 |
12.68 |
3.06 |
37.00 |
49 |
|
|
Meat |
3.04 |
1.90 |
0.30 |
0.14 |
1.63 |
0.00 |
14.31 |
161 |
|
|
Sugar |
29.32 |
19.98 |
20.56 |
19.69 |
22.96 |
4.77 |
50.34 |
43 |
|
|
Fruits and Vegetables |
16.59 |
16.20 |
18.12 |
7.65 |
15.08 |
0.81 |
28.06 |
52 |
|
|
Oils |
8.57 |
6.13 |
10.22 |
13.78 |
9.09 |
1.84 |
31.15 |
63 |
|
|
|
|
|
|
|
|
|
|
![]()
![]()
![]()