![]()
![]()
![]()
|
Pakistan |
Mean |
1970-2001 |
|||||||
|
1970-1979 |
1980-1989 |
1990-1995 |
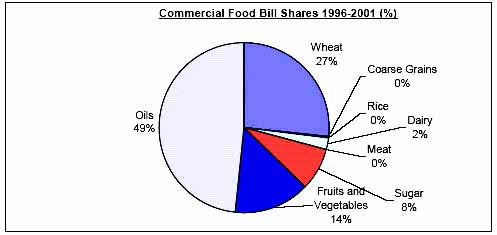
1996-2001 |
Mean |
Min. |
Max. |
Variation (%) |
||
|
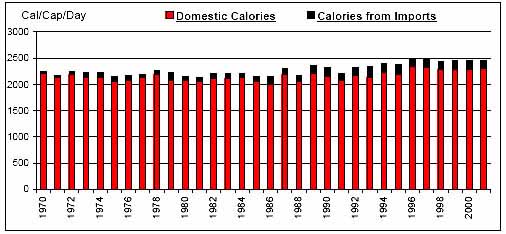
Per Caput Consumption (Cal/Day) |
2213 |
2204 |
2326 |
2463 |
2278 |
2136 |
2493 |
5 |
|
|
Imports / Consumption (%) |
Wheat |
10.83 |
5.71 |
11.71 |
9.38 |
9.12 |
0.78 |
18.35 |
54 |
|
Coarse Grains |
0.40 |
0.06 |
0.27 |
0.22 |
0.24 |
0.00 |
2.81 |
231 |
|
|
Rice |
0.17 |
0.00 |
0.05 |
0.05 |
0.07 |
0.00 |
1.69 |
421 |
|
|
Dairy |
1.23 |
2.11 |
0.92 |
0.33 |
1.28 |
0.12 |
3.23 |
72 |
|
|
Meat |
0.02 |
0.00 |
0.00 |
0.01 |
0.01 |
0.00 |
0.05 |
146 |
|
|
Sugar |
0.15 |
0.44 |
0.44 |
0.62 |
0.38 |
0.00 |
1.86 |
155 |
|
|
Fruits and Vegetables |
1.46 |
2.79 |
3.29 |
4.79 |
2.85 |
0.73 |
6.25 |
50 |
|
|
Oils |
11.25 |
21.50 |
24.46 |
26.04 |
19.70 |
3.81 |
31.16 |
37 |
|
|
Per Caput Calories from Imports (Cal/Cap/Day) |
82 |
109 |
173 |
165 |
123 |
37 |
203 |
38 |
|
|
Aid + Commercial Food Import Bill (US$ 000) |
294,056 |
702,767 |
1,130,496 |
1,375,665 |
781,412 |
53,830 |
1,678,907 |
60 |
|
|
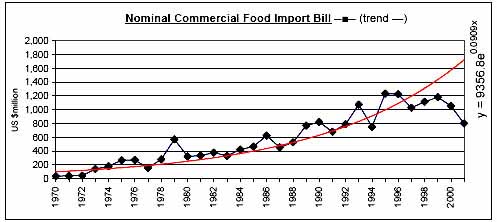
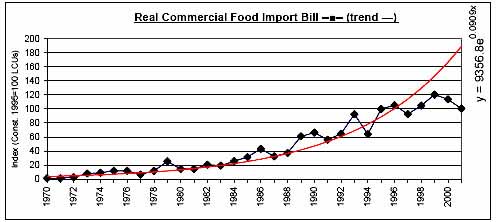
Commercial Food Import Bill (US$ 000) |
201,577 |
464,693 |
894,089 |
1,068,617 |
576,217 |
38,981 |
1,236,350 |
65 |
|
|
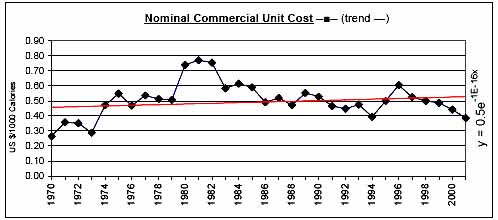
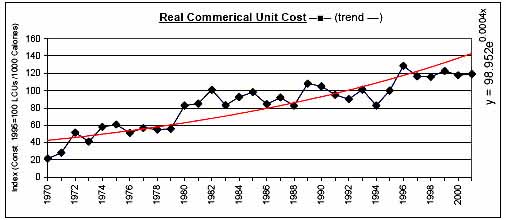
Commerical Unit Cost (US $/1000 calories) |
0.43 |
0.61 |
0.47 |
0.49 |
0.51 |
0.27 |
0.77 |
23 |
|
|
Commercial Food Import Bill / GDP (%) |
1.00 |
1.37 |
1.75 |
1.65 |
1.37 |
0.24 |
2.43 |
38 |
|
|
Comm. Fd. Imp. Bill / Total Merchandise Imp. Bill (%) |
10.97 |
7.92 |
10.14 |
10.11 |
9.70 |
5.53 |
18.13 |
31 |
|
|
Comm. Fd. Imp. Bill / Total Merchandise Exp. Bill (%) |
18.20 |
14.61 |
13.47 |
12.68 |
15.15 |
8.21 |
33.15 |
34 |
|
|
Commercial Food Value Bill Shares (%) |
Wheat |
31.00 |
11.69 |
32.58 |
26.57 |
24.43 |
0.00 |
57.13 |
77 |
|
Coarse Grains |
0.31 |
0.02 |
0.08 |
0.37 |
0.19 |
0.00 |
2.82 |
275 |
|
|
Rice |
0.75 |
0.00 |
0.09 |
0.11 |
0.27 |
0.00 |
7.47 |
485 |
|
|
Dairy |
6.92 |
8.45 |
3.17 |
2.00 |
5.77 |
0.95 |
14.18 |
69 |
|
|
Meat |
0.11 |
0.01 |
0.00 |
0.04 |
0.04 |
0.00 |
0.42 |
208 |
|
|
Sugar |
4.61 |
8.61 |
7.43 |
8.01 |
7.03 |
0.00 |
35.23 |
143 |
|
|
Fruits and Vegetables |
12.55 |
15.21 |
10.56 |
14.48 |
13.37 |
4.73 |
35.12 |
54 |
|
|
Oils |
43.75 |
56.01 |
46.09 |
48.44 |
48.90 |
18.34 |
76.89 |
25 |
|
|
|
|
|
|
|
|
|
|
![]()
![]()
![]()