![]()
![]()
![]()
|
Peru |
Mean |
1970-2001 |
|||||||
|
1970-1979 |
1980-1989 |
1990-1995 |
1996-2001 |
Mean |
Min. |
Max. |
Variation (%) |
||
|
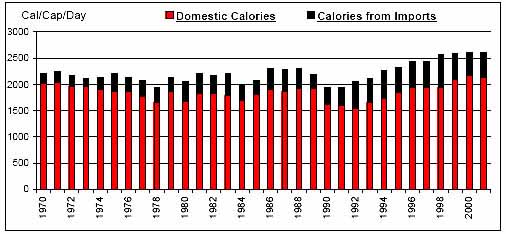
Per Caput Consumption (Cal/Day) |
2133 |
2175 |
2105 |
2539 |
2217 |
1932 |
2610 |
9 |
|
|
Imports / Consumption (%) |
Wheat |
84.03 |
89.57 |
91.44 |
89.07 |
88.10 |
76.05 |
92.92 |
4 |
|
Coarse Grains |
12.44 |
31.74 |
46.94 |
45.36 |
31.11 |
2.22 |
59.31 |
54 |
|
|
Rice |
5.71 |
12.97 |
23.63 |
12.10 |
12.54 |
0.00 |
35.89 |
85 |
|
|
Dairy |
24.86 |
26.97 |
23.93 |
24.67 |
25.31 |
16.80 |
37.07 |
19 |
|
|
Meat |
3.08 |
4.93 |
2.00 |
1.87 |
3.23 |
0.04 |
15.31 |
93 |
|
|
Sugar |
N/A |
2.06 |
4.05 |
4.38 |
2.22 |
0.00 |
7.81 |
99 |
|
|
Fruits and Vegetables |
0.32 |
1.63 |
2.16 |
2.41 |
1.47 |
0.03 |
3.50 |
70 |
|
|
Oils |
23.62 |
23.32 |
37.89 |
51.73 |
31.47 |
4.15 |
67.68 |
49 |
|
|
Per Caput Calories from Imports (Cal/Cap/Day) |
244 |
354 |
442 |
505 |
364 |
146 |
611 |
32 |
|
|
Aid + Commercial Food Import Bill (US$ 000) |
203,067 |
485,768 |
709,472 |
861,732 |
509,862 |
87,613 |
1,065,341 |
55 |
|
|
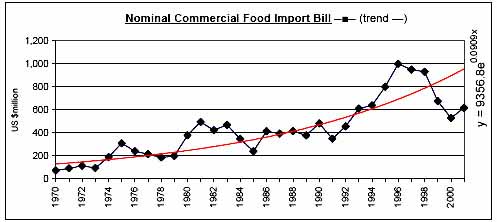
Commercial Food Import Bill (US$ 000) |
171,174 |
395,192 |
556,057 |
783,374 |
428,133 |
74,470 |
999,142 |
59 |
|
|
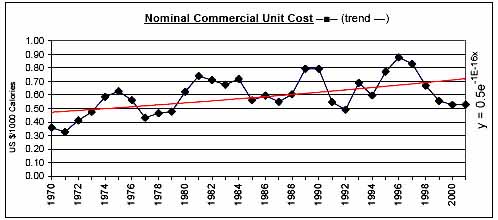
Commerical Unit Cost (US $/1000 calories) |
0.47 |
0.66 |
0.65 |
0.67 |
0.60 |
0.33 |
0.88 |
23 |
|
|
Commercial Food Import Bill / GDP (%) |
0.66 |
1.27 |
1.77 |
1.96 |
1.30 |
0.36 |
2.66 |
46 |
|
|
Comm. Fd. Imp. Bill / Total Merchandise Imp. Bill (%) |
11.93 |
14.59 |
10.98 |
9.79 |
12.18 |
6.02 |
21.00 |
23 |
|
|
Comm. Fd. Imp. Bill / Total Merchandise Exp. Bill (%) |
12.14 |
12.97 |
14.08 |
12.38 |
12.81 |
5.41 |
23.62 |
30 |
|
|
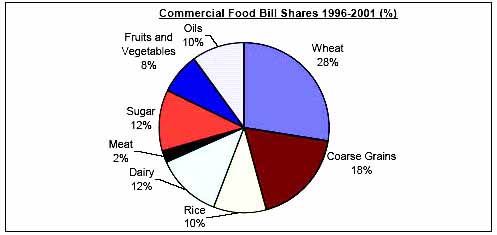
Commercial Food Value Bill Shares (%) |
Wheat |
46.41 |
37.42 |
29.81 |
27.62 |
36.96 |
20.40 |
66.15 |
27 |
|
Coarse Grains |
8.18 |
15.02 |
18.28 |
18.32 |
14.11 |
0.80 |
23.14 |
46 |
|
|
Rice |
2.24 |
2.67 |
8.13 |
10.00 |
4.93 |
0.00 |
22.36 |
143 |
|
|
Dairy |
18.48 |
12.35 |
12.62 |
12.25 |
14.30 |
7.58 |
31.46 |
35 |
|
|
Meat |
6.26 |
8.63 |
3.86 |
2.30 |
5.81 |
0.19 |
24.50 |
100 |
|
|
Sugar |
N/A |
11.01 |
14.97 |
11.68 |
8.44 |
0.00 |
22.72 |
87 |
|
|
Fruits and Vegetables |
2.92 |
5.89 |
5.56 |
7.89 |
5.27 |
0.79 |
10.64 |
54 |
|
|
Oils |
15.51 |
7.01 |
6.77 |
9.93 |
10.17 |
3.46 |
26.51 |
53 |
|
|
|
|
|
|
|
|
|
|
![]()
![]()
![]()