![]()
![]()
![]()
|
Rwanda |
Mean |
1970-2001 |
|||||||
|
1970-1979 |
1980-1989 |
1990-1995 |
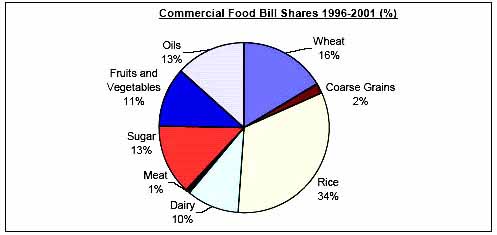
1996-2001 |
Mean |
Min. |
Max. |
Variation (%) |
||
|
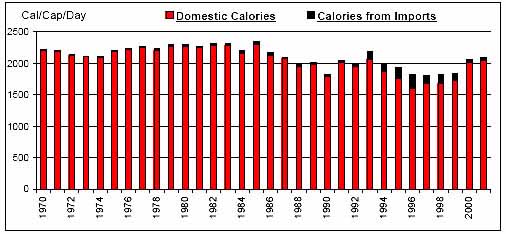
Per Caput Consumption (Cal/Day) |
2202 |
2199 |
1996 |
1904 |
2107 |
1800 |
2346 |
8 |
|
|
Imports / Consumption (%) |
Wheat |
71.95 |
69.86 |
55.81 |
65.83 |
67.12 |
26.09 |
92.31 |
26 |
|
Coarse Grains |
0.33 |
0.30 |
20.47 |
33.06 |
10.23 |
0.00 |
60.28 |
181 |
|
|
Rice |
37.24 |
47.32 |
40.00 |
58.31 |
44.86 |
12.73 |
78.72 |
43 |
|
|
Dairy |
4.96 |
17.89 |
11.52 |
6.33 |
10.49 |
0.58 |
32.18 |
78 |
|
|
Meat |
0.25 |
0.15 |
0.26 |
0.28 |
0.22 |
0.02 |
1.09 |
94 |
|
|
Sugar |
15.00 |
21.99 |
26.27 |
18.86 |
20.02 |
1.83 |
46.14 |
57 |
|
|
Fruits and Vegetables |
0.04 |
0.05 |
1.39 |
1.75 |
0.62 |
0.00 |
4.65 |
170 |
|
|
Oils |
18.71 |
32.76 |
44.55 |
43.36 |
32.57 |
2.57 |
63.13 |
43 |
|
|
Per Caput Calories from Imports (Cal/Cap/Day) |
16 |
35 |
87 |
113 |
53 |
5 |
226 |
99 |
|
|
Aid + Commercial Food Import Bill (US$ 000) |
6,971 |
27,624 |
49,638 |
65,012 |
32,308 |
1,722 |
90,150 |
78 |
|
|
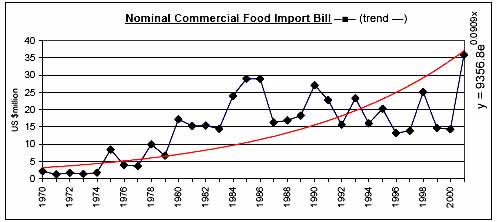
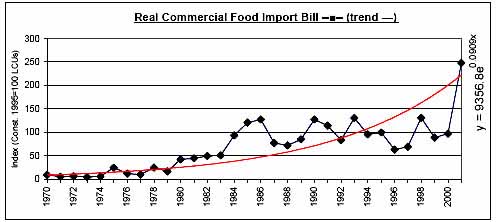
Commercial Food Import Bill (US$ 000) |
4,145 |
19,609 |
20,894 |
19,564 |
15,009 |
1,284 |
35,918 |
61 |
|
|
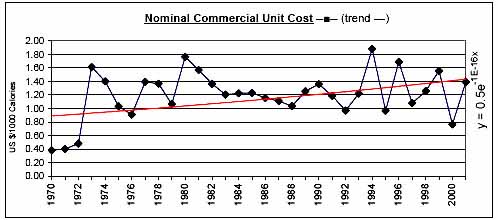
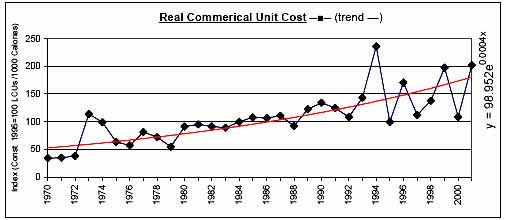
Commerical Unit Cost (US $/1000 calories) |
1.01 |
1.29 |
1.26 |
1.29 |
1.20 |
0.38 |
1.88 |
30 |
|
|
Commercial Food Import Bill / GDP (%) |
0.23 |
0.80 |
1.01 |
0.81 |
0.66 |
0.08 |
1.33 |
56 |
|
|
Comm. Fd. Imp. Bill / Total Merchandise Imp. Bill (%) |
4.89 |
6.37 |
7.43 |
8.08 |
6.43 |
3.18 |
14.37 |
38 |
|
|
Comm. Fd. Imp. Bill / Total Merchandise Exp. Bill (%) |
8.25 |
19.56 |
25.64 |
26.90 |
18.54 |
3.87 |
42.26 |
55 |
|
|
Commercial Food Value Bill Shares (%) |
Wheat |
5.43 |
9.74 |
12.25 |
16.47 |
10.12 |
0.00 |
35.00 |
94 |
|
Coarse Grains |
0.83 |
0.20 |
0.92 |
1.87 |
0.85 |
0.00 |
11.21 |
299 |
|
|
Rice |
16.06 |
17.77 |
12.14 |
32.80 |
19.00 |
3.12 |
60.53 |
65 |
|
|
Dairy |
20.53 |
20.14 |
20.64 |
10.06 |
18.47 |
3.73 |
53.99 |
49 |
|
|
Meat |
2.61 |
0.53 |
1.12 |
0.81 |
1.35 |
0.18 |
5.45 |
98 |
|
|
Sugar |
19.78 |
25.37 |
19.46 |
13.33 |
20.26 |
3.45 |
43.48 |
53 |
|
|
Fruits and Vegetables |
7.98 |
4.14 |
3.35 |
11.34 |
6.54 |
0.00 |
34.65 |
121 |
|
|
Oils |
26.77 |
22.11 |
30.12 |
13.31 |
23.42 |
0.00 |
59.98 |
61 |
|
|
|
|
|
|
|
|
|
|
![]()
![]()
![]()