![]()
![]()
![]()
|
Samoa |
Mean |
1970-2001 |
|||||||
|
1970-1979 |
1980-1989 |
1990-1995 |
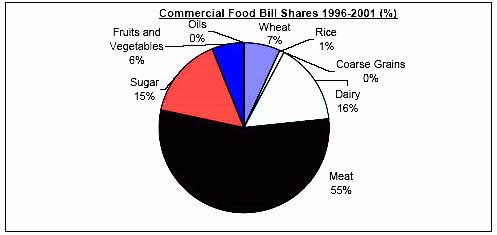
1996-2001 |
Mean |
Min. |
Max. |
Variation (%) |
||
|
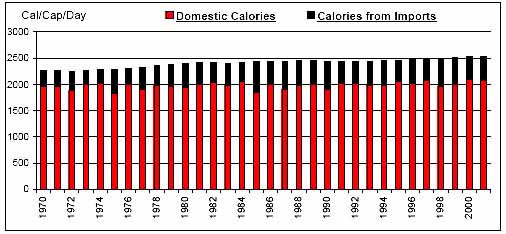
Per Caput Consumption (Cal/Day) |
2293 |
2427 |
2444 |
2500 |
2402 |
2249 |
2533 |
3 |
|
|
Imports / Consumption (%) |
Wheat |
100.00 |
100.00 |
100.00 |
100.00 |
100.00 |
100.00 |
100.00 |
0 |
|
Coarse Grains |
100.00 |
100.00 |
100.00 |
100.00 |
100.00 |
100.00 |
100.00 |
0 |
|
|
Rice |
100.00 |
100.00 |
100.00 |
100.00 |
100.00 |
100.00 |
100.00 |
0 |
|
|
Dairy |
77.96 |
69.71 |
77.80 |
79.18 |
75.58 |
51.55 |
84.14 |
9 |
|
|
Meat |
58.59 |
53.71 |
59.65 |
59.65 |
57.47 |
43.07 |
68.31 |
11 |
|
|
Sugar |
99.59 |
99.72 |
99.77 |
99.79 |
99.70 |
99.44 |
99.88 |
0 |
|
|
Fruits and Vegetables |
1.66 |
1.87 |
4.15 |
3.91 |
2.61 |
1.11 |
5.98 |
49 |
|
|
Oils |
N/A |
N/A |
N/A |
N/A |
N/A |
0.00 |
0.00 |
N/A |
|
|
Per Caput Calories from Imports (Cal/Cap/Day) |
346 |
456 |
456 |
463 |
423 |
260 |
593 |
19 |
|
|
Aid + Commercial Food Import Bill (US$ 000) |
6,133 |
10,087 |
14,242 |
14,730 |
10,501 |
2,493 |
20,446 |
40 |
|
|
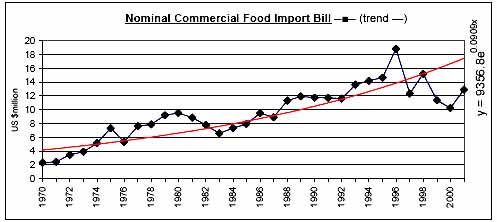
Commercial Food Import Bill (US$ 000) |
5,484 |
8,984 |
12,943 |
13,497 |
9,479 |
2,339 |
18,825 |
41 |
|
|
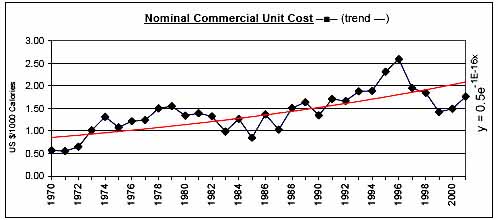
Commerical Unit Cost (US $/1000 calories) |
1.07 |
1.27 |
1.80 |
1.85 |
1.42 |
0.55 |
2.59 |
32 |
|
|
Commercial Food Import Bill / GDP (%) |
21.45 |
19.52 |
12.59 |
10.66 |
17.17 |
7.42 |
32.85 |
50 |
|
|
Comm. Fd. Imp. Bill / Total Merchandise Imp. Bill (%) |
18.29 |
15.27 |
14.10 |
12.79 |
15.53 |
9.64 |
23.64 |
21 |
|
|
Comm. Fd. Imp. Bill / Total Merchandise Exp. Bill (%) |
60.86 |
64.43 |
216.12 |
97.00 |
97.86 |
37.41 |
403.32 |
76 |
|
|
Commercial Food Value Bill Shares (%) |
Wheat |
17.42 |
16.18 |
8.61 |
6.84 |
13.40 |
4.28 |
22.11 |
40 |
|
Coarse Grains |
0.31 |
1.79 |
0.19 |
0.02 |
0.70 |
0.00 |
3.38 |
159 |
|
|
Rice |
8.98 |
6.42 |
3.14 |
0.90 |
5.57 |
0.39 |
14.96 |
73 |
|
|
Dairy |
10.25 |
12.10 |
15.02 |
15.62 |
12.73 |
8.04 |
19.92 |
23 |
|
|
Meat |
39.77 |
39.50 |
53.46 |
54.97 |
45.10 |
28.08 |
63.78 |
20 |
|
|
Sugar |
16.72 |
18.53 |
13.28 |
15.46 |
16.40 |
6.57 |
25.51 |
23 |
|
|
Fruits and Vegetables |
6.55 |
5.48 |
6.31 |
6.19 |
6.10 |
3.37 |
8.20 |
20 |
|
|
Oils |
N/A |
N/A |
N/A |
N/A |
N/A |
0.00 |
0.00 |
N/A |
|
|
|
|
|
|
|
|
|
|
![]()
![]()
![]()