![]()
![]()
![]()
|
Sao Tome Pm |
Mean |
1970-2001 |
|||||||
|
1970-1979 |
1980-1989 |
1990-1995 |
1996-2001 |
Mean |
Min. |
Max. |
Variation (%) |
||
|
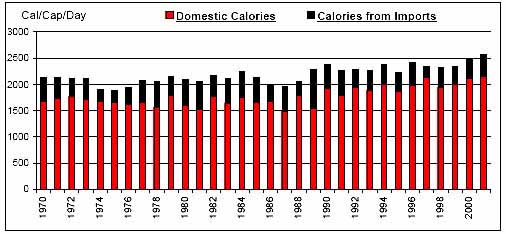
Per Caput Consumption (Cal/Day) |
2047 |
2106 |
2300 |
2411 |
2181 |
1877 |
2567 |
8 |
|
|
Imports / Consumption (%) |
Wheat |
100.00 |
100.00 |
100.00 |
100.00 |
100.00 |
100.00 |
100.00 |
0 |
|
Coarse Grains |
74.68 |
48.00 |
1.17 |
1.16 |
38.77 |
0.00 |
83.02 |
92 |
|
|
Rice |
100.00 |
100.00 |
100.00 |
100.00 |
100.00 |
100.00 |
100.00 |
0 |
|
|
Dairy |
94.43 |
95.05 |
89.60 |
89.35 |
92.77 |
82.16 |
97.24 |
4 |
|
|
Meat |
9.28 |
34.27 |
19.64 |
17.41 |
20.56 |
5.05 |
52.70 |
63 |
|
|
Sugar |
100.00 |
100.00 |
100.00 |
100.00 |
100.00 |
100.00 |
100.00 |
0 |
|
|
Fruits and Vegetables |
24.21 |
7.96 |
4.01 |
2.02 |
11.18 |
1.16 |
34.51 |
94 |
|
|
Oils |
0.31 |
1.82 |
1.80 |
2.55 |
1.48 |
0.15 |
4.09 |
70 |
|
|
Per Caput Calories from Imports (Cal/Cap/Day) |
367 |
464 |
404 |
360 |
403 |
199 |
742 |
25 |
|
|
Aid + Commercial Food Import Bill (US$ 000) |
2,562 |
5,312 |
5,146 |
5,305 |
4,420 |
1,527 |
8,528 |
39 |
|
|
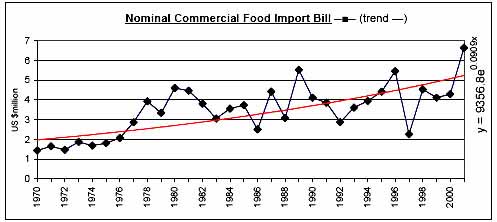
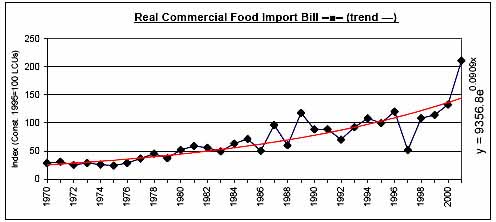
Commercial Food Import Bill (US$ 000) |
2,214 |
3,876 |
3,804 |
4,550 |
3,469 |
1,446 |
6,645 |
37 |
|
|
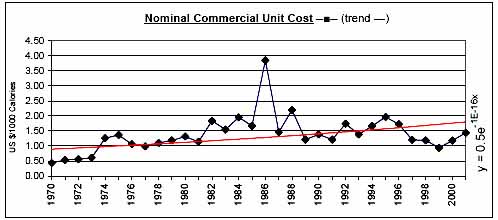
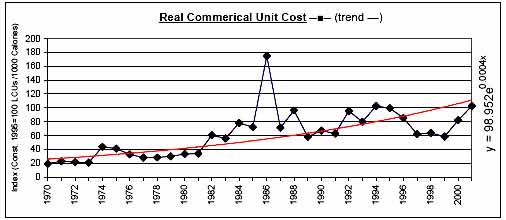
Commerical Unit Cost (US $/1000 calories) |
0.91 |
1.82 |
1.56 |
1.28 |
1.39 |
0.44 |
3.86 |
44 |
|
|
Commercial Food Import Bill / GDP (%) |
2.63 |
3.75 |
3.69 |
3.94 |
3.42 |
2.05 |
5.40 |
27 |
|
|
Comm. Fd. Imp. Bill / Total Merchandise Imp. Bill (%) |
18.93 |
20.97 |
11.59 |
10.75 |
16.66 |
5.50 |
31.86 |
39 |
|
|
Comm. Fd. Imp. Bill / Total Merchandise Exp. Bill (%) |
16.39 |
36.37 |
69.90 |
39.59 |
37.02 |
9.28 |
93.66 |
66 |
|
|
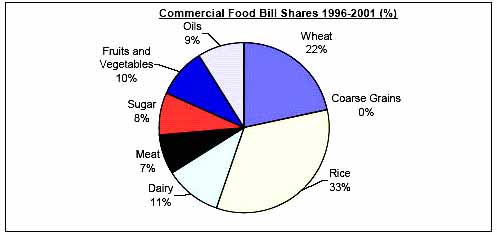
Commercial Food Value Bill Shares (%) |
Wheat |
12.96 |
10.05 |
20.34 |
21.57 |
15.05 |
0.00 |
29.42 |
58 |
|
Coarse Grains |
6.62 |
1.22 |
0.00 |
0.00 |
2.45 |
0.00 |
9.15 |
137 |
|
|
Rice |
22.09 |
32.76 |
34.32 |
33.57 |
29.87 |
15.90 |
52.10 |
32 |
|
|
Dairy |
16.23 |
18.40 |
10.38 |
10.93 |
14.82 |
6.24 |
28.79 |
41 |
|
|
Meat |
1.22 |
11.98 |
8.65 |
7.49 |
7.15 |
0.76 |
29.92 |
96 |
|
|
Sugar |
18.71 |
11.61 |
15.36 |
8.08 |
13.87 |
5.64 |
45.74 |
62 |
|
|
Fruits and Vegetables |
18.74 |
8.44 |
6.49 |
9.51 |
11.50 |
0.00 |
26.98 |
61 |
|
|
Oils |
3.44 |
5.54 |
4.46 |
8.84 |
5.30 |
0.00 |
12.44 |
59 |
|
|
|
|
|
|
|
|
|
|
![]()
![]()
![]()