![]()
![]()
![]()
|
Senegal |
Mean |
1970-2001 |
|||||||
|
1970-1979 |
1980-1989 |
1990-1995 |
1996-2001 |
Mean |
Min. |
Max. |
Variation (%) |
||
|
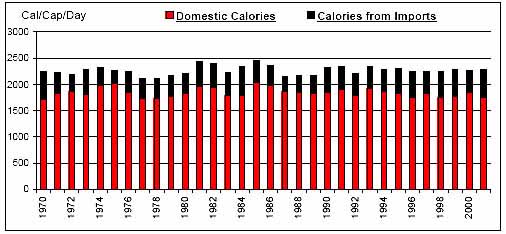
Per Caput Consumption (Cal/Day) |
2213 |
2290 |
2295 |
2256 |
2261 |
2105 |
2458 |
4 |
|
|
Imports / Consumption (%) |
Wheat |
100.00 |
100.00 |
100.00 |
100.00 |
100.00 |
100.00 |
100.00 |
0 |
|
Coarse Grains |
7.50 |
7.18 |
4.05 |
4.74 |
6.24 |
1.56 |
22.50 |
84 |
|
|
Rice |
67.60 |
72.91 |
69.19 |
74.87 |
70.92 |
46.88 |
82.34 |
10 |
|
|
Dairy |
38.52 |
56.38 |
56.22 |
47.39 |
49.08 |
25.43 |
65.42 |
22 |
|
|
Meat |
0.82 |
2.28 |
1.41 |
1.03 |
1.43 |
0.39 |
6.47 |
108 |
|
|
Sugar |
53.89 |
3.32 |
4.17 |
5.74 |
19.74 |
0.00 |
100.00 |
159 |
|
|
Fruits and Vegetables |
32.33 |
19.67 |
10.97 |
13.53 |
20.84 |
6.56 |
38.40 |
45 |
|
|
Oils |
2.33 |
7.47 |
14.04 |
14.58 |
8.43 |
0.34 |
18.54 |
75 |
|
|
Per Caput Calories from Imports (Cal/Cap/Day) |
387 |
406 |
438 |
477 |
419 |
237 |
548 |
17 |
|
|
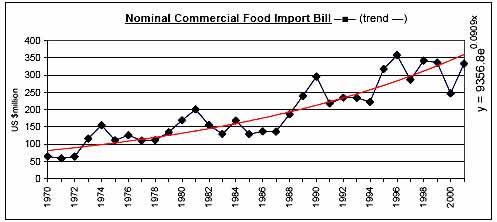
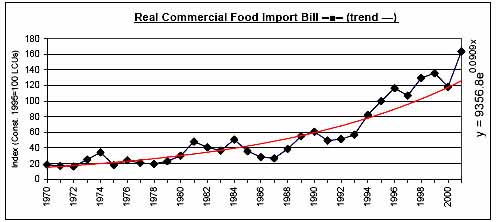
Aid + Commercial Food Import Bill (US$ 000) |
122,790 |
201,803 |
283,739 |
344,459 |
219,223 |
63,620 |
386,749 |
42 |
|
|
Commercial Food Import Bill (US$ 000) |
105,651 |
165,736 |
254,216 |
317,751 |
192,052 |
59,543 |
358,344 |
46 |
|
|
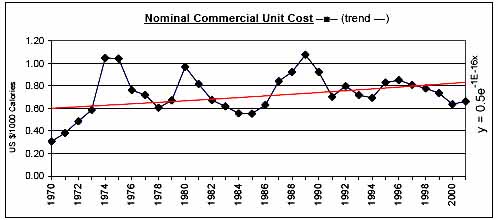
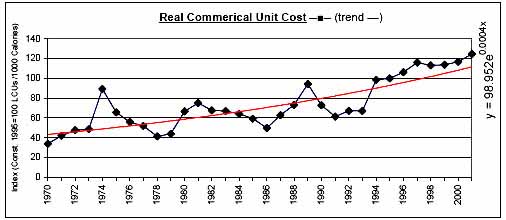
Commerical Unit Cost (US $/1000 calories) |
0.66 |
0.77 |
0.78 |
0.75 |
0.73 |
0.31 |
1.08 |
25 |
|
|
Commercial Food Import Bill / GDP (%) |
2.60 |
3.34 |
4.37 |
4.36 |
3.49 |
1.63 |
5.55 |
30 |
|
|
Comm. Fd. Imp. Bill / Total Merchandise Imp. Bill (%) |
23.02 |
16.06 |
20.64 |
20.84 |
19.99 |
12.65 |
33.84 |
27 |
|
|
Comm. Fd. Imp. Bill / Total Merchandise Exp. Bill (%) |
33.92 |
28.08 |
33.62 |
32.86 |
31.84 |
17.80 |
59.94 |
27 |
|
|
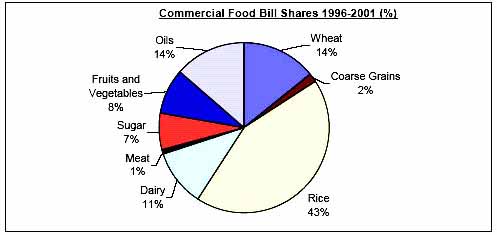
Commercial Food Value Bill Shares (%) |
Wheat |
12.82 |
10.91 |
15.94 |
14.21 |
13.07 |
7.45 |
24.24 |
26 |
|
Coarse Grains |
1.77 |
1.82 |
1.90 |
1.58 |
1.77 |
0.00 |
7.46 |
114 |
|
|
Rice |
30.62 |
39.22 |
31.82 |
43.25 |
35.90 |
18.39 |
48.26 |
21 |
|
|
Dairy |
10.44 |
15.88 |
18.78 |
11.09 |
13.83 |
5.31 |
26.16 |
37 |
|
|
Meat |
0.62 |
1.68 |
1.16 |
0.61 |
1.05 |
0.00 |
5.00 |
116 |
|
|
Sugar |
20.10 |
5.00 |
6.02 |
7.13 |
10.31 |
0.01 |
31.89 |
81 |
|
|
Fruits and Vegetables |
17.79 |
12.97 |
9.27 |
8.47 |
12.94 |
5.86 |
23.63 |
36 |
|
|
Oils |
5.84 |
12.53 |
15.12 |
13.66 |
11.14 |
1.27 |
27.88 |
61 |
|
|
|
|
|
|
|
|
|
|
![]()
![]()
![]()