![]()
![]()
![]()
|
Sierra Leone |
Mean |
1970-2001 |
|||||||
|
1970-1979 |
1980-1989 |
1990-1995 |
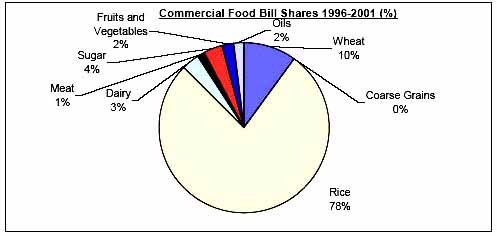
1996-2001 |
Mean |
Min. |
Max. |
Variation (%) |
||
|
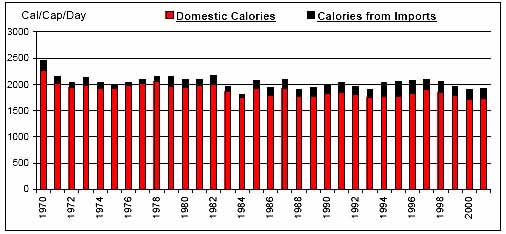
Per Caput Consumption (Cal/Day) |
2122 |
2003 |
1995 |
2001 |
2038 |
1815 |
2449 |
6 |
|
|
Imports / Consumption (%) |
Wheat |
100.00 |
100.00 |
100.00 |
100.00 |
100.00 |
100.00 |
100.00 |
0 |
|
Coarse Grains |
2.46 |
2.51 |
0.93 |
0.31 |
1.79 |
0.00 |
11.28 |
148 |
|
|
Rice |
5.18 |
12.82 |
25.89 |
35.51 |
17.14 |
0.00 |
42.96 |
75 |
|
|
Dairy |
45.00 |
45.84 |
34.12 |
22.83 |
39.06 |
19.77 |
64.04 |
30 |
|
|
Meat |
7.30 |
2.69 |
5.48 |
5.26 |
5.13 |
1.17 |
12.63 |
53 |
|
|
Sugar |
100.00 |
23.65 |
25.84 |
34.31 |
49.92 |
10.82 |
100.00 |
76 |
|
|
Fruits and Vegetables |
3.19 |
2.53 |
2.31 |
2.87 |
2.76 |
1.57 |
4.82 |
30 |
|
|
Oils |
2.72 |
4.92 |
5.70 |
6.65 |
4.70 |
1.58 |
11.72 |
54 |
|
|
Per Caput Calories from Imports (Cal/Cap/Day) |
119 |
137 |
200 |
201 |
156 |
58 |
272 |
34 |
|
|
Aid + Commercial Food Import Bill (US$ 000) |
30,544 |
52,472 |
77,671 |
105,279 |
60,246 |
17,104 |
133,773 |
52 |
|
|
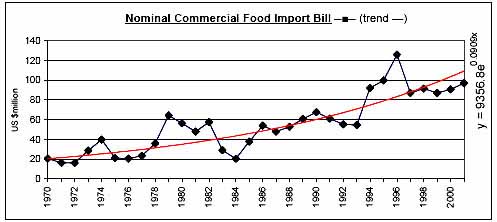
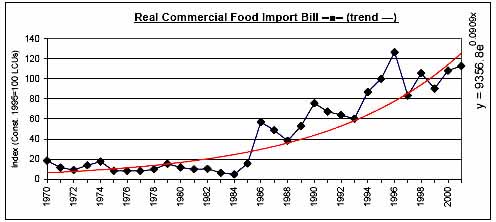
Commercial Food Import Bill (US$ 000) |
28,719 |
46,425 |
71,750 |
96,560 |
55,041 |
16,172 |
126,003 |
53 |
|
|
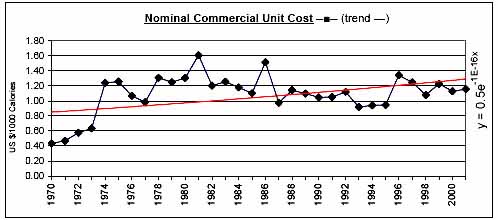
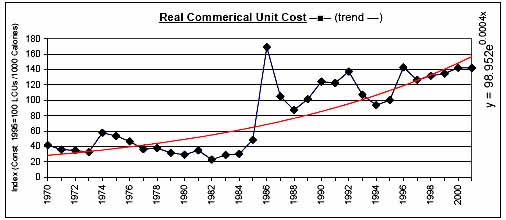
Commerical Unit Cost (US $/1000 calories) |
0.92 |
1.24 |
1.01 |
1.20 |
1.09 |
0.44 |
1.61 |
24 |
|
|
Commercial Food Import Bill / GDP (%) |
3.69 |
5.51 |
9.29 |
22.10 |
8.76 |
2.20 |
24.01 |
80 |
|
|
Comm. Fd. Imp. Bill / Total Merchandise Imp. Bill (%) |
15.29 |
23.92 |
42.62 |
35.70 |
26.94 |
11.38 |
61.18 |
48 |
|
|
Comm. Fd. Imp. Bill / Total Merchandise Exp. Bill (%) |
21.08 |
34.59 |
81.12 |
414.69 |
110.36 |
13.91 |
544.05 |
147 |
|
|
Commercial Food Value Bill Shares (%) |
Wheat |
19.78 |
9.51 |
6.62 |
10.08 |
12.28 |
4.06 |
29.32 |
54 |
|
Coarse Grains |
0.01 |
0.89 |
0.11 |
N/A |
0.30 |
0.00 |
3.67 |
249 |
|
|
Rice |
22.03 |
50.88 |
67.64 |
77.53 |
50.00 |
0.02 |
80.42 |
50 |
|
|
Dairy |
13.05 |
9.94 |
5.95 |
3.10 |
8.88 |
2.88 |
17.33 |
54 |
|
|
Meat |
3.99 |
1.50 |
2.07 |
1.41 |
2.37 |
0.75 |
5.98 |
57 |
|
|
Sugar |
24.11 |
11.19 |
7.98 |
3.58 |
13.20 |
2.76 |
36.04 |
71 |
|
|
Fruits and Vegetables |
11.64 |
10.57 |
5.33 |
2.27 |
8.37 |
0.00 |
17.54 |
55 |
|
|
Oils |
5.40 |
5.53 |
4.31 |
2.02 |
4.60 |
0.00 |
10.41 |
52 |
|
|
|
|
|
|
|
|
|
|
![]()
![]()
![]()