![]()
![]()
![]()
|
Solomon Is |
Mean |
1970-2001 |
|||||||
|
1970-1979 |
1980-1989 |
1990-1995 |
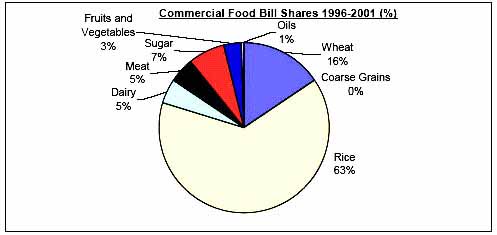
1996-2001 |
Mean |
Min. |
Max. |
Variation (%) |
||
|
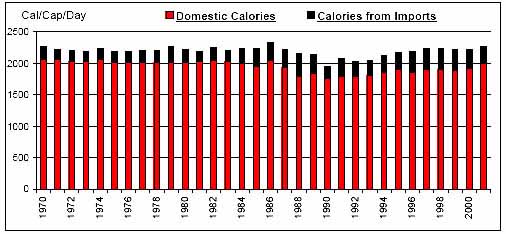
Per Caput Consumption (Cal/Day) |
2215 |
2219 |
2065 |
2227 |
2191 |
1946 |
2336 |
4 |
|
|
Imports / Consumption (%) |
Wheat |
100.00 |
100.00 |
100.00 |
100.00 |
100.00 |
100.00 |
100.00 |
0 |
|
Coarse Grains |
100.00 |
100.00 |
N/A |
N/A |
100.00 |
100.00 |
100.00 |
0 |
|
|
Rice |
50.22 |
52.63 |
100.00 |
90.95 |
67.94 |
10.89 |
100.00 |
46 |
|
|
Dairy |
60.15 |
63.22 |
65.44 |
62.28 |
62.50 |
47.75 |
78.04 |
11 |
|
|
Meat |
26.92 |
35.18 |
18.45 |
12.34 |
25.18 |
2.68 |
47.55 |
45 |
|
|
Sugar |
100.00 |
100.00 |
100.00 |
100.00 |
100.00 |
100.00 |
100.00 |
0 |
|
|
Fruits and Vegetables |
2.54 |
4.67 |
3.73 |
2.81 |
3.48 |
1.80 |
9.98 |
52 |
|
|
Oils |
0.21 |
0.27 |
0.04 |
0.02 |
0.16 |
0.02 |
0.46 |
85 |
|
|
Per Caput Calories from Imports (Cal/Cap/Day) |
185 |
252 |
249 |
315 |
242 |
154 |
369 |
26 |
|
|
Aid + Commercial Food Import Bill (US$ 000) |
3,538 |
8,736 |
11,532 |
14,426 |
8,703 |
1,897 |
15,654 |
51 |
|
|
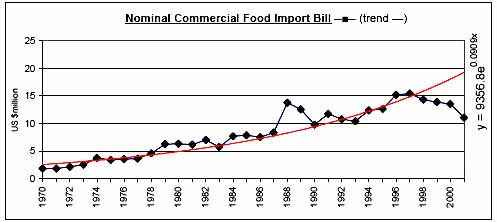
Commercial Food Import Bill (US$ 000) |
3,377 |
8,317 |
11,324 |
13,929 |
8,389 |
1,848 |
15,439 |
52 |
|
|
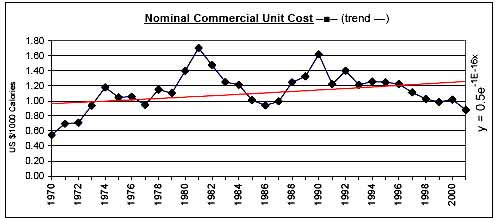
Commerical Unit Cost (US $/1000 calories) |
0.94 |
1.26 |
1.33 |
1.04 |
1.13 |
0.55 |
1.71 |
22 |
|
|
Commercial Food Import Bill / GDP (%) |
2.44 |
4.57 |
4.97 |
5.34 |
4.12 |
1.54 |
7.25 |
35 |
|
|
Comm. Fd. Imp. Bill / Total Merchandise Imp. Bill (%) |
14.07 |
11.12 |
9.24 |
11.32 |
11.72 |
7.62 |
16.57 |
22 |
|
|
Comm. Fd. Imp. Bill / Total Merchandise Exp. Bill (%) |
16.34 |
11.70 |
10.45 |
13.45 |
13.25 |
7.52 |
23.34 |
36 |
|
|
Commercial Food Value Bill Shares (%) |
Wheat |
14.48 |
14.04 |
10.36 |
15.57 |
13.77 |
4.94 |
23.90 |
31 |
|
Coarse Grains |
2.92 |
3.52 |
N/A |
N/A |
2.01 |
0.00 |
7.46 |
111 |
|
|
Rice |
27.83 |
25.87 |
51.91 |
64.09 |
38.53 |
12.77 |
71.94 |
45 |
|
|
Dairy |
7.59 |
7.94 |
9.32 |
4.86 |
7.51 |
3.08 |
11.96 |
27 |
|
|
Meat |
24.87 |
26.88 |
10.18 |
4.73 |
18.97 |
1.44 |
34.79 |
54 |
|
|
Sugar |
11.98 |
9.51 |
10.76 |
6.89 |
10.03 |
4.35 |
18.05 |
32 |
|
|
Fruits and Vegetables |
5.27 |
7.34 |
6.84 |
3.35 |
5.85 |
2.07 |
23.09 |
64 |
|
|
Oils |
5.06 |
4.90 |
0.62 |
0.51 |
3.32 |
0.32 |
8.09 |
81 |
|
|
|
|
|
|
|
|
|
|
![]()
![]()
![]()