![]()
![]()
![]()
|
Sri Lanka |
Mean |
1970-2001 |
|||||||
|
1970-1979 |
1980-1989 |
1990-1995 |
1996-2001 |
Mean |
Min. |
Max. |
Variation (%) |
||
|
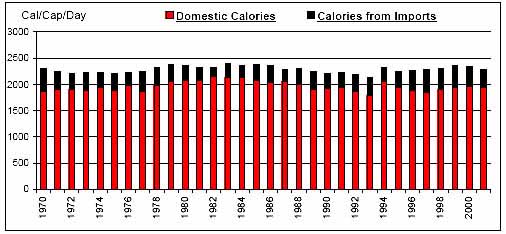
Per Caput Consumption (Cal/Day) |
2258 |
2330 |
2215 |
2303 |
2281 |
2122 |
2388 |
3 |
|
|
Imports / Consumption (%) |
Wheat |
100.00 |
100.00 |
100.00 |
100.00 |
100.00 |
100.00 |
100.00 |
0 |
|
Coarse Grains |
5.08 |
20.84 |
55.34 |
76.54 |
32.83 |
0.10 |
82.85 |
89 |
|
|
Rice |
19.32 |
6.40 |
4.59 |
6.55 |
10.13 |
0.32 |
28.73 |
77 |
|
|
Dairy |
37.43 |
45.05 |
46.22 |
57.38 |
45.20 |
24.08 |
64.55 |
26 |
|
|
Meat |
0.21 |
0.67 |
1.02 |
2.18 |
0.87 |
0.01 |
2.70 |
90 |
|
|
Sugar |
40.57 |
34.04 |
24.80 |
30.57 |
33.70 |
11.22 |
65.80 |
38 |
|
|
Fruits and Vegetables |
5.12 |
4.10 |
8.23 |
20.45 |
8.26 |
0.02 |
23.12 |
88 |
|
|
Oils |
0.06 |
0.75 |
2.30 |
4.48 |
1.53 |
0.02 |
5.62 |
114 |
|
|
Per Caput Calories from Imports (Cal/Cap/Day) |
334 |
271 |
304 |
393 |
320 |
185 |
447 |
19 |
|
|
Aid + Commercial Food Import Bill (US$ 000) |
231,584 |
299,425 |
421,251 |
593,860 |
356,274 |
137,449 |
654,581 |
42 |
|
|
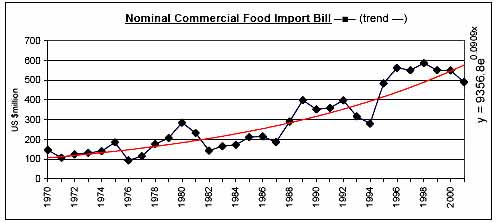
Commercial Food Import Bill (US$ 000) |
142,518 |
229,870 |
365,251 |
548,663 |
287,730 |
93,698 |
586,503 |
55 |
|
|
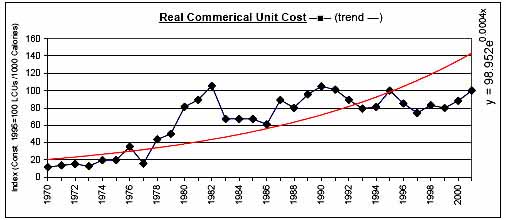
Commerical Unit Cost (US $/1000 calories) |
0.42 |
0.73 |
0.84 |
0.78 |
0.67 |
0.26 |
0.98 |
30 |
|
|
Commercial Food Import Bill / GDP (%) |
3.53 |
3.54 |
4.03 |
4.50 |
3.81 |
2.20 |
5.42 |
24 |
|
|
Comm. Fd. Imp. Bill / Total Merchandise Imp. Bill (%) |
24.65 |
11.77 |
10.17 |
9.33 |
15.04 |
6.32 |
37.58 |
55 |
|
|
Comm. Fd. Imp. Bill / Total Merchandise Exp. Bill (%) |
27.97 |
18.33 |
14.18 |
11.79 |
19.34 |
8.87 |
43.02 |
45 |
|
|
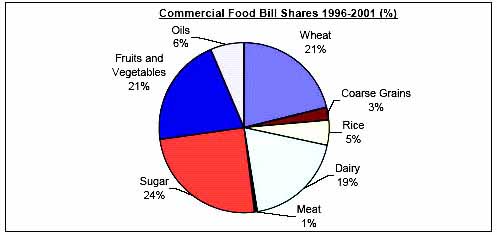
Commercial Food Value Bill Shares (%) |
Wheat |
41.66 |
23.67 |
23.33 |
21.10 |
28.74 |
0.00 |
72.27 |
62 |
|
Coarse Grains |
0.24 |
1.11 |
2.41 |
2.54 |
1.35 |
0.00 |
4.19 |
88 |
|
|
Rice |
17.73 |
7.17 |
7.91 |
4.66 |
10.14 |
0.00 |
80.83 |
163 |
|
|
Dairy |
9.35 |
15.96 |
16.51 |
19.34 |
14.63 |
6.89 |
23.34 |
34 |
|
|
Meat |
0.09 |
0.55 |
0.43 |
0.52 |
0.38 |
0.00 |
1.02 |
73 |
|
|
Sugar |
24.81 |
36.55 |
30.65 |
24.75 |
29.57 |
8.01 |
59.74 |
32 |
|
|
Fruits and Vegetables |
5.77 |
12.60 |
14.40 |
20.64 |
12.31 |
0.17 |
26.92 |
62 |
|
|
Oils |
0.35 |
2.40 |
4.36 |
6.46 |
2.89 |
0.00 |
8.76 |
87 |
|
|
|
|
|
|
|
|
|
|
![]()
![]()
![]()