![]()
![]()
![]()
|
St Kitts Nev |
Mean |
1970-2001 |
|||||||
|
1970-1979 |
1980-1989 |
1990-1995 |
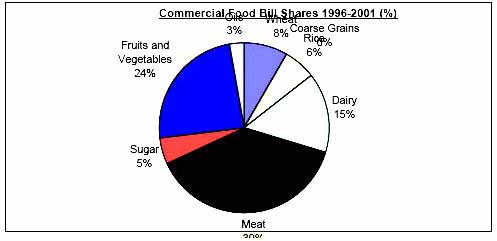
1996-2001 |
Mean |
Min. |
Max. |
Variation (%) |
||
|
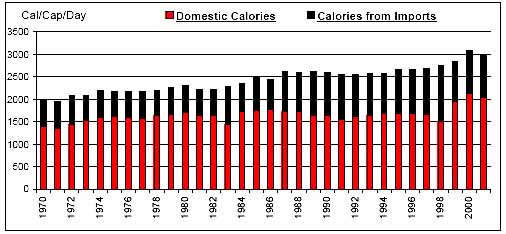
Per Caput Consumption (Cal/Day) |
2124 |
2413 |
2586 |
2838 |
2435 |
1940 |
3095 |
12 |
|
|
Imports / Consumption (%) |
Wheat |
100.00 |
100.00 |
100.00 |
100.00 |
100.00 |
100.00 |
100.00 |
0 |
|
Coarse Grains |
N/A |
100.00 |
100.00 |
100.00 |
100.00 |
100.00 |
100.00 |
0 |
|
|
Rice |
100.00 |
100.00 |
100.00 |
100.00 |
100.00 |
100.00 |
100.00 |
0 |
|
|
Dairy |
100.00 |
100.00 |
100.00 |
100.00 |
100.00 |
100.00 |
100.00 |
0 |
|
|
Meat |
69.52 |
80.56 |
84.78 |
84.31 |
78.61 |
65.51 |
86.20 |
9 |
|
|
Sugar |
0.10 |
0.10 |
0.50 |
0.72 |
0.29 |
0.00 |
0.96 |
98 |
|
|
Fruits and Vegetables |
33.87 |
50.75 |
52.59 |
56.29 |
46.86 |
26.36 |
60.11 |
21 |
|
|
Oils |
19.76 |
24.85 |
26.24 |
27.22 |
23.97 |
16.37 |
34.27 |
23 |
|
|
Per Caput Calories from Imports (Cal/Cap/Day) |
587 |
739 |
947 |
1010 |
781 |
544 |
1244 |
25 |
|
|
Aid + Commercial Food Import Bill (US$ 000) |
3,497 |
8,275 |
12,181 |
13,346 |
8,465 |
2,278 |
16,504 |
49 |
|
|
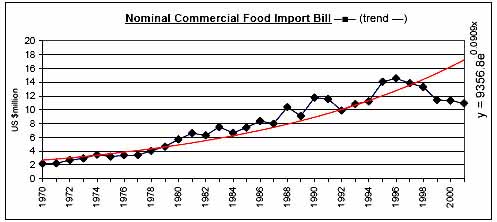
Commercial Food Import Bill (US$ 000) |
3,240 |
7,619 |
11,574 |
12,585 |
7,923 |
2,176 |
14,573 |
49 |
|
|
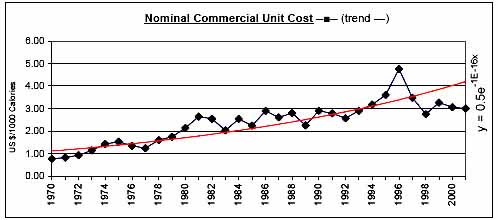
Commerical Unit Cost (US $/1000 calories) |
1.26 |
2.47 |
3.00 |
3.39 |
2.36 |
0.77 |
4.77 |
39 |
|
|
Commercial Food Import Bill / GDP (%) |
3.51 |
5.21 |
5.33 |
4.45 |
4.56 |
2.90 |
5.96 |
21 |
|
|
Comm. Fd. Imp. Bill / Total Merchandise Imp. Bill (%) |
16.28 |
12.61 |
8.72 |
8.10 |
12.18 |
5.79 |
18.72 |
31 |
|
|
Comm. Fd. Imp. Bill / Total Merchandise Exp. Bill (%) |
32.60 |
32.35 |
39.27 |
34.65 |
34.15 |
14.81 |
55.75 |
29 |
|
|
Commercial Food Value Bill Shares (%) |
Wheat |
19.46 |
13.86 |
9.37 |
8.22 |
13.71 |
0.00 |
24.76 |
42 |
|
Coarse Grains |
N/A |
0.24 |
0.18 |
0.10 |
0.13 |
0.00 |
1.79 |
252 |
|
|
Rice |
10.43 |
7.17 |
6.27 |
6.13 |
7.83 |
3.94 |
15.28 |
42 |
|
|
Dairy |
18.60 |
18.48 |
18.94 |
15.35 |
18.02 |
11.91 |
23.01 |
16 |
|
|
Meat |
30.05 |
34.38 |
39.28 |
38.29 |
34.68 |
26.86 |
46.64 |
16 |
|
|
Sugar |
2.32 |
1.37 |
3.40 |
5.04 |
2.74 |
0.00 |
8.38 |
78 |
|
|
Fruits and Vegetables |
12.17 |
19.58 |
19.37 |
24.23 |
18.10 |
9.43 |
29.28 |
28 |
|
|
Oils |
6.98 |
4.92 |
3.19 |
2.64 |
4.81 |
2.05 |
9.44 |
41 |
|
|
|
|
|
|
|
|
|
|
![]()
![]()
![]()