![]()
![]()
![]()
|
St Lucia |
Mean |
1970-2001 |
|||||||
|
1970-1979 |
1980-1989 |
1990-1995 |
1996-2001 |
Mean |
Min. |
Max. |
Variation (%) |
||
|
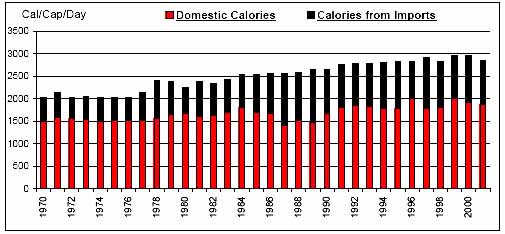
Per Caput Consumption (Cal/Day) |
2127 |
2481 |
2768 |
2893 |
2501 |
2025 |
2958 |
13 |
|
|
Imports / Consumption (%) |
Wheat |
100.00 |
100.00 |
100.00 |
100.00 |
100.00 |
100.00 |
100.00 |
0 |
|
Coarse Grains |
48.20 |
100.00 |
100.00 |
100.00 |
83.81 |
6.25 |
100.00 |
38 |
|
|
Rice |
100.00 |
100.00 |
100.00 |
100.00 |
100.00 |
100.00 |
100.00 |
0 |
|
|
Dairy |
86.64 |
89.77 |
92.48 |
93.28 |
89.96 |
83.53 |
94.19 |
3 |
|
|
Meat |
66.75 |
75.76 |
83.11 |
81.47 |
75.39 |
60.85 |
85.56 |
10 |
|
|
Sugar |
100.00 |
100.00 |
100.00 |
100.00 |
100.00 |
100.00 |
100.00 |
0 |
|
|
Fruits and Vegetables |
1.91 |
3.02 |
3.96 |
6.26 |
3.46 |
1.17 |
7.17 |
48 |
|
|
Oils |
1.12 |
4.26 |
4.98 |
5.39 |
3.63 |
0.60 |
8.77 |
64 |
|
|
Per Caput Calories from Imports (Cal/Cap/Day) |
581 |
866 |
983 |
995 |
823 |
471 |
1182 |
27 |
|
|
Aid + Commercial Food Import Bill (US$ 000) |
8,401 |
22,733 |
42,332 |
46,319 |
26,351 |
3,801 |
51,850 |
61 |
|
|
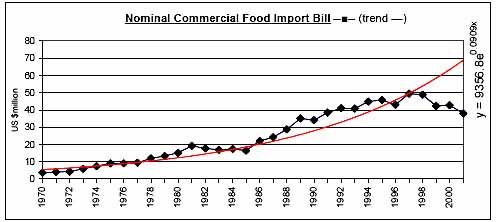
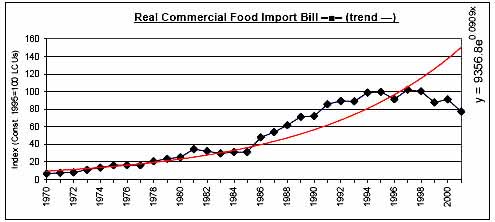
Commercial Food Import Bill (US$ 000) |
7,830 |
21,331 |
40,867 |
44,116 |
25,047 |
3,604 |
49,562 |
62 |
|
|
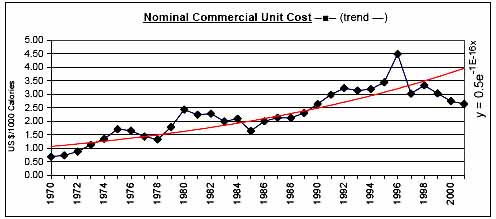
Commerical Unit Cost (US $/1000 calories) |
1.27 |
2.12 |
3.10 |
3.21 |
2.24 |
0.69 |
4.50 |
39 |
|
|
Commercial Food Import Bill / GDP (%) |
5.05 |
7.71 |
9.32 |
8.77 |
7.38 |
3.17 |
10.23 |
27 |
|
|
Comm. Fd. Imp. Bill / Total Merchandise Imp. Bill (%) |
15.13 |
13.74 |
13.72 |
12.65 |
13.97 |
8.18 |
19.38 |
15 |
|
|
Comm. Fd. Imp. Bill / Total Merchandise Exp. Bill (%) |
54.34 |
35.14 |
36.39 |
71.13 |
48.12 |
24.12 |
95.11 |
37 |
|
|
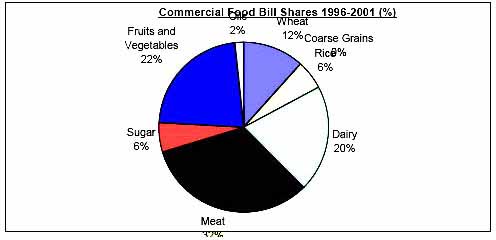
Commercial Food Value Bill Shares (%) |
Wheat |
18.48 |
12.70 |
10.50 |
11.58 |
13.88 |
3.95 |
25.23 |
35 |
|
Coarse Grains |
0.30 |
0.37 |
0.53 |
0.10 |
0.33 |
0.00 |
1.58 |
140 |
|
|
Rice |
4.24 |
4.61 |
4.01 |
5.53 |
4.55 |
1.87 |
7.85 |
26 |
|
|
Dairy |
16.98 |
17.33 |
18.02 |
20.33 |
17.91 |
14.85 |
21.33 |
10 |
|
|
Meat |
33.31 |
35.76 |
39.86 |
32.62 |
35.17 |
25.67 |
44.33 |
14 |
|
|
Sugar |
9.98 |
9.46 |
6.31 |
5.57 |
8.30 |
3.41 |
18.55 |
43 |
|
|
Fruits and Vegetables |
13.01 |
16.69 |
18.85 |
22.66 |
17.06 |
9.89 |
24.93 |
23 |
|
|
Oils |
3.72 |
3.08 |
1.92 |
1.62 |
2.79 |
1.34 |
4.73 |
39 |
|
|
|
|
|
|
|
|
|
|
![]()
![]()
![]()