![]()
![]()
![]()
|
St Vincent |
Mean |
1970-2001 |
|||||||
|
1970-1979 |
1980-1989 |
1990-1995 |
1996-2001 |
Mean |
Min. |
Max. |
Variation (%) |
||
|
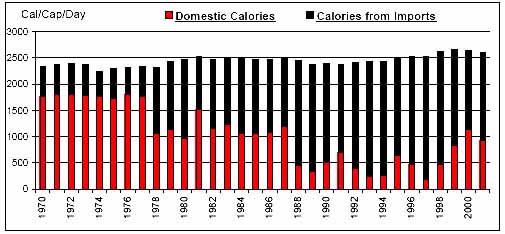
Per Caput Consumption (Cal/Day) |
2343 |
2469 |
2425 |
2596 |
2445 |
2249 |
2662 |
4 |
|
|
Imports / Consumption (%) |
Wheat |
100.00 |
100.00 |
100.00 |
100.00 |
100.00 |
100.00 |
100.00 |
0 |
|
Coarse Grains |
4.68 |
57.02 |
64.92 |
67.39 |
44.09 |
0.00 |
88.10 |
74 |
|
|
Rice |
100.00 |
99.97 |
99.95 |
100.00 |
99.98 |
99.72 |
100.00 |
0 |
|
|
Dairy |
79.25 |
72.91 |
81.70 |
83.00 |
78.43 |
64.88 |
85.86 |
7 |
|
|
Meat |
63.53 |
75.55 |
82.18 |
82.61 |
74.36 |
55.29 |
84.69 |
11 |
|
|
Sugar |
92.96 |
11.78 |
20.85 |
21.90 |
40.75 |
4.05 |
100.00 |
94 |
|
|
Fruits and Vegetables |
2.14 |
2.96 |
1.45 |
2.30 |
2.30 |
0.63 |
3.67 |
34 |
|
|
Oils |
1.06 |
5.18 |
8.50 |
6.31 |
4.72 |
0.48 |
12.69 |
77 |
|
|
Per Caput Calories from Imports (Cal/Cap/Day) |
705 |
1469 |
1969 |
1926 |
1410 |
489 |
2337 |
42 |
|
|
Aid + Commercial Food Import Bill (US$ 000) |
6,276 |
15,714 |
22,439 |
26,294 |
16,009 |
2,790 |
30,877 |
51 |
|
|
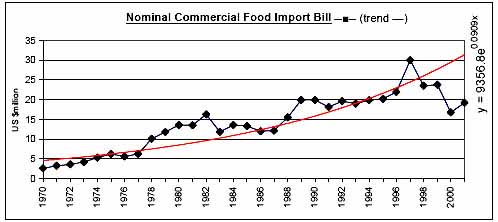
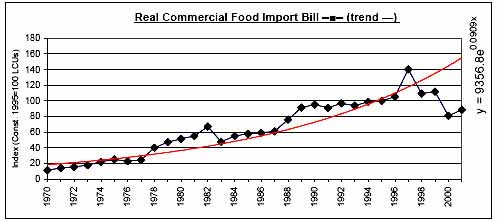
Commercial Food Import Bill (US$ 000) |
5,911 |
14,192 |
19,478 |
22,564 |
14,165 |
2,607 |
30,015 |
49 |
|
|
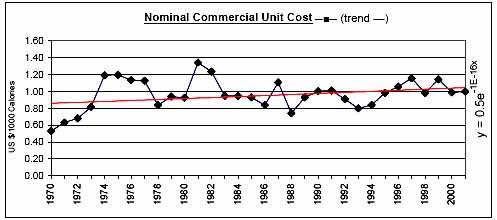
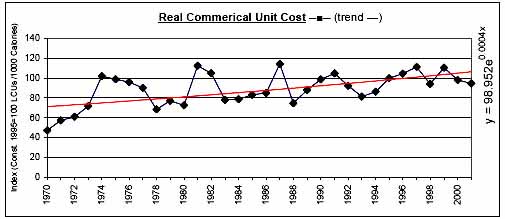
Commerical Unit Cost (US $/1000 calories) |
0.91 |
1.00 |
0.92 |
1.06 |
0.97 |
0.53 |
1.34 |
19 |
|
|
Commercial Food Import Bill / GDP (%) |
7.16 |
10.28 |
9.10 |
8.78 |
8.80 |
4.14 |
13.65 |
26 |
|
|
Comm. Fd. Imp. Bill / Total Merchandise Imp. Bill (%) |
21.95 |
18.11 |
14.47 |
13.57 |
17.78 |
11.40 |
27.93 |
27 |
|
|
Comm. Fd. Imp. Bill / Total Merchandise Exp. Bill (%) |
80.24 |
35.87 |
30.49 |
47.44 |
50.90 |
18.26 |
120.93 |
53 |
|
|
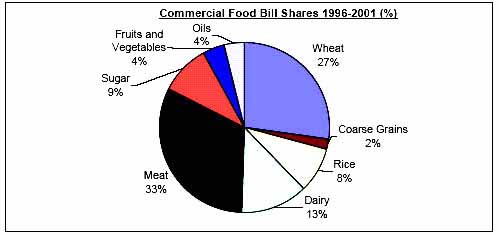
Commercial Food Value Bill Shares (%) |
Wheat |
29.34 |
36.34 |
28.04 |
27.27 |
30.90 |
13.42 |
50.62 |
29 |
|
Coarse Grains |
0.18 |
4.09 |
2.42 |
1.98 |
2.16 |
0.00 |
15.03 |
140 |
|
|
Rice |
7.60 |
3.71 |
2.41 |
8.40 |
5.56 |
0.00 |
20.19 |
88 |
|
|
Dairy |
17.92 |
11.17 |
13.65 |
12.84 |
14.05 |
9.54 |
22.43 |
25 |
|
|
Meat |
17.53 |
25.71 |
32.90 |
32.04 |
25.69 |
11.42 |
42.15 |
30 |
|
|
Sugar |
17.75 |
8.21 |
11.26 |
9.30 |
11.97 |
4.27 |
31.09 |
45 |
|
|
Fruits and Vegetables |
6.59 |
7.13 |
5.08 |
4.32 |
6.05 |
1.91 |
10.12 |
32 |
|
|
Oils |
3.08 |
3.64 |
4.24 |
3.86 |
3.62 |
1.69 |
6.49 |
33 |
|
|
|
|
|
|
|
|
|
|
![]()
![]()
![]()