![]()
![]()
![]()
|
Sudan |
Mean |
1970-2001 |
|||||||
|
1970-1979 |
1980-1989 |
1990-1995 |
1996-2001 |
Mean |
Min. |
Max. |
Variation (%) |
||
|
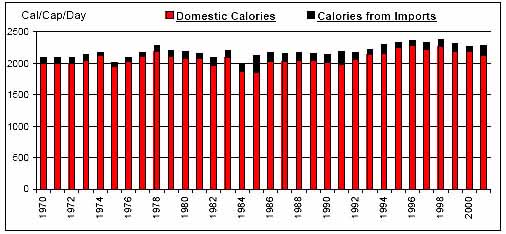
Per Caput Consumption (Cal/Day) |
2134 |
2141 |
2226 |
2323 |
2189 |
1973 |
2372 |
4 |
|
|
Imports / Consumption (%) |
Wheat |
45.85 |
72.23 |
47.89 |
62.39 |
57.58 |
30.79 |
93.14 |
30 |
|
Coarse Grains |
0.00 |
1.62 |
4.26 |
1.24 |
1.54 |
0.00 |
9.71 |
155 |
|
|
Rice |
40.36 |
85.32 |
94.43 |
80.75 |
72.12 |
0.04 |
98.77 |
40 |
|
|
Dairy |
1.27 |
3.04 |
1.16 |
0.66 |
1.69 |
0.31 |
4.95 |
72 |
|
|
Meat |
0.04 |
0.03 |
0.01 |
0.04 |
0.03 |
0.00 |
0.31 |
197 |
|
|
Sugar |
13.90 |
3.86 |
0.12 |
0.37 |
5.64 |
0.00 |
23.39 |
127 |
|
|
Fruits and Vegetables |
0.79 |
1.37 |
2.42 |
1.79 |
1.46 |
0.38 |
4.35 |
57 |
|
|
Oils |
0.12 |
3.55 |
9.15 |
5.08 |
3.82 |
0.08 |
17.31 |
107 |
|
|
Per Caput Calories from Imports (Cal/Cap/Day) |
81 |
132 |
124 |
109 |
110 |
59 |
276 |
40 |
|
|
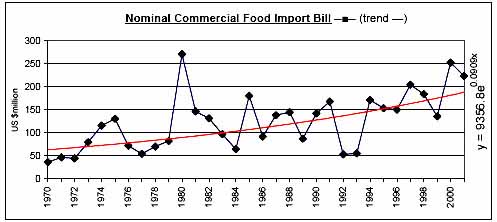
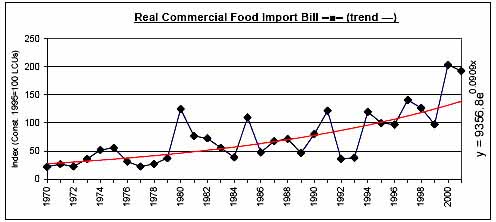
Aid + Commercial Food Import Bill (US$ 000) |
87,195 |
232,361 |
205,235 |
237,450 |
182,864 |
38,294 |
374,664 |
45 |
|
|
Commercial Food Import Bill (US$ 000) |
73,343 |
135,337 |
124,029 |
191,818 |
124,434 |
36,500 |
271,197 |
50 |
|
|
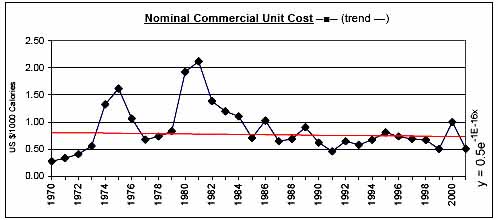
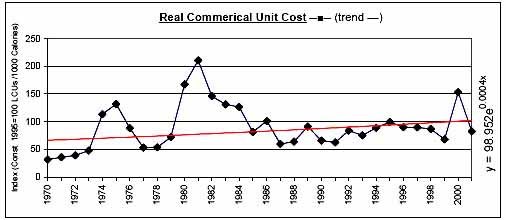
Commerical Unit Cost (US $/1000 calories) |
0.78 |
1.17 |
0.63 |
0.68 |
0.86 |
0.28 |
2.12 |
51 |
|
|
Commercial Food Import Bill / GDP (%) |
0.48 |
0.65 |
0.47 |
0.51 |
0.53 |
0.21 |
1.42 |
45 |
|
|
Comm. Fd. Imp. Bill / Total Merchandise Imp. Bill (%) |
10.92 |
11.13 |
11.65 |
12.08 |
11.34 |
4.84 |
19.39 |
37 |
|
|
Comm. Fd. Imp. Bill / Total Merchandise Exp. Bill (%) |
16.35 |
26.71 |
26.50 |
22.37 |
22.62 |
8.50 |
47.55 |
47 |
|
|
Commercial Food Value Bill Shares (%) |
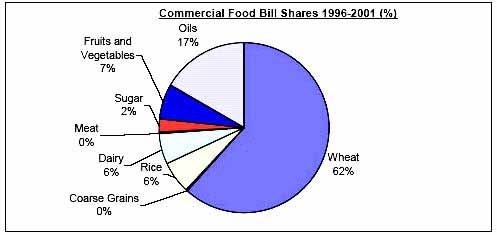
Wheat |
15.75 |
15.08 |
43.63 |
61.77 |
29.40 |
0.00 |
78.56 |
82 |
|
Coarse Grains |
N/A |
2.23 |
4.10 |
0.16 |
1.50 |
0.00 |
22.26 |
310 |
|
|
Rice |
2.55 |
9.05 |
10.61 |
6.10 |
6.76 |
0.00 |
26.39 |
82 |
|
|
Dairy |
4.61 |
20.04 |
10.64 |
5.97 |
10.81 |
1.84 |
32.80 |
80 |
|
|
Meat |
0.10 |
0.15 |
0.04 |
0.15 |
0.11 |
0.00 |
0.52 |
109 |
|
|
Sugar |
69.85 |
29.05 |
1.00 |
2.42 |
31.55 |
0.00 |
85.33 |
109 |
|
|
Fruits and Vegetables |
6.06 |
10.47 |
7.53 |
6.66 |
7.83 |
0.00 |
15.94 |
56 |
|
|
Oils |
1.08 |
13.93 |
22.45 |
16.78 |
12.04 |
0.00 |
42.03 |
99 |
|
|
|
|
|
|
|
|
|
|
![]()
![]()
![]()