![]()
![]()
![]()
|
Tanzania |
Mean |
1970-2001 |
|||||||
|
1970-1979 |
1980-1989 |
1990-1995 |
1996-2001 |
Mean |
Min. |
Max. |
Variation (%) |
||
|
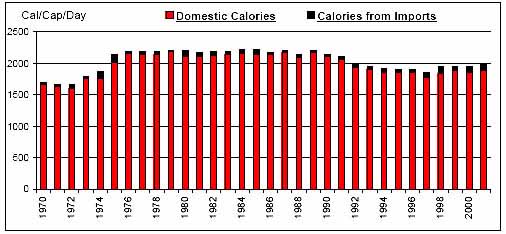
Per Caput Consumption (Cal/Day) |
1960 |
2191 |
2000 |
1936 |
2035 |
1659 |
2220 |
9 |
|
|
Imports / Consumption (%) |
Wheat |
38.79 |
42.12 |
52.14 |
69.59 |
48.11 |
13.15 |
81.62 |
35 |
|
Coarse Grains |
5.56 |
4.08 |
1.78 |
2.05 |
3.73 |
0.01 |
19.14 |
119 |
|
|
Rice |
9.64 |
15.74 |
9.91 |
14.89 |
12.58 |
2.48 |
28.37 |
57 |
|
|
Dairy |
12.71 |
5.75 |
2.77 |
2.66 |
6.79 |
1.14 |
16.25 |
68 |
|
|
Meat |
0.25 |
0.06 |
0.02 |
0.17 |
0.13 |
0.01 |
0.61 |
122 |
|
|
Sugar |
2.05 |
1.08 |
2.67 |
9.84 |
3.33 |
0.00 |
12.56 |
106 |
|
|
Fruits and Vegetables |
0.38 |
0.04 |
0.47 |
0.80 |
0.37 |
0.00 |
1.74 |
126 |
|
|
Oils |
3.15 |
3.10 |
7.34 |
13.36 |
5.83 |
1.27 |
20.42 |
80 |
|
|
Per Caput Calories from Imports (Cal/Cap/Day) |
56 |
54 |
48 |
90 |
60 |
24 |
120 |
48 |
|
|
Aid + Commercial Food Import Bill (US$ 000) |
60,917 |
89,234 |
103,788 |
250,575 |
113,365 |
21,043 |
407,827 |
73 |
|
|
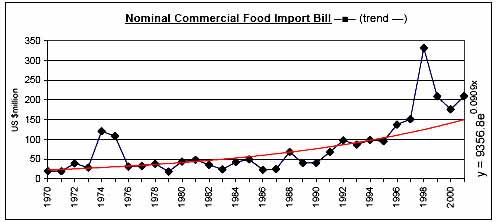
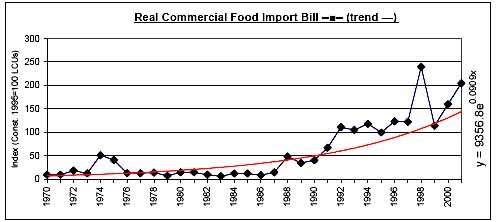
Commercial Food Import Bill (US$ 000) |
45,610 |
39,809 |
80,977 |
202,672 |
79,878 |
18,486 |
331,835 |
90 |
|
|
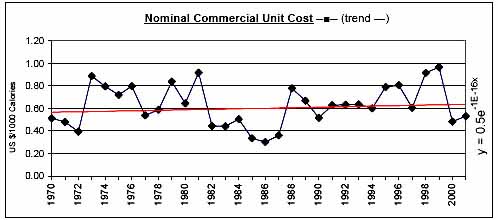
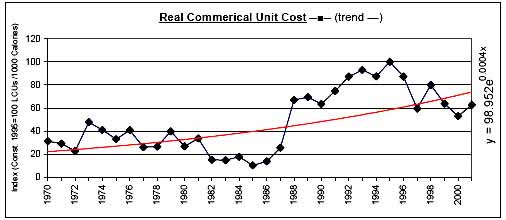
Commerical Unit Cost (US $/1000 calories) |
0.66 |
0.54 |
0.64 |
0.72 |
0.63 |
0.30 |
0.97 |
29 |
|
|
Commercial Food Import Bill / GDP (%) |
1.57 |
1.05 |
1.62 |
3.34 |
1.75 |
0.55 |
5.66 |
68 |
|
|
Comm. Fd. Imp. Bill / Total Merchandise Imp. Bill (%) |
7.04 |
3.62 |
5.41 |
13.25 |
6.83 |
1.71 |
21.14 |
67 |
|
|
Comm. Fd. Imp. Bill / Total Merchandise Exp. Bill (%) |
11.69 |
9.43 |
17.44 |
30.88 |
15.66 |
3.52 |
56.38 |
73 |
|
|
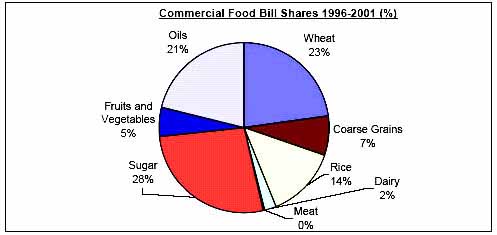
Commercial Food Value Bill Shares (%) |
Wheat |
10.09 |
16.41 |
18.87 |
22.90 |
16.11 |
0.00 |
35.89 |
63 |
|
Coarse Grains |
11.48 |
29.37 |
6.01 |
7.37 |
15.28 |
0.00 |
72.01 |
117 |
|
|
Rice |
9.10 |
4.02 |
19.68 |
13.60 |
10.34 |
0.00 |
31.42 |
108 |
|
|
Dairy |
26.38 |
15.81 |
6.95 |
2.17 |
14.89 |
1.87 |
47.33 |
82 |
|
|
Meat |
1.14 |
0.62 |
0.17 |
0.46 |
0.67 |
0.05 |
3.33 |
120 |
|
|
Sugar |
16.72 |
11.82 |
15.86 |
26.91 |
16.94 |
0.00 |
44.80 |
65 |
|
|
Fruits and Vegetables |
6.24 |
2.02 |
3.31 |
5.45 |
4.22 |
0.00 |
15.40 |
92 |
|
|
Oils |
18.85 |
19.91 |
29.15 |
21.13 |
21.54 |
5.66 |
45.11 |
46 |
|
|
|
|
|
|
|
|
|
|
![]()
![]()
![]()