![]()
![]()
![]()
|
Togo |
Mean |
1970-2001 |
|||||||
|
1970-1979 |
1980-1989 |
1990-1995 |
1996-2001 |
Mean |
Min. |
Max. |
Variation (%) |
||
|
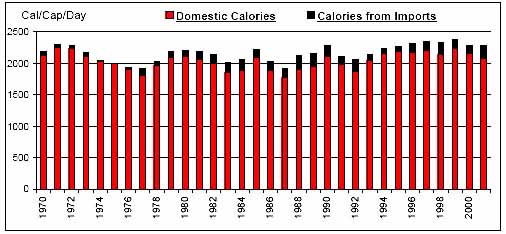
Per Caput Consumption (Cal/Day) |
2104 |
2105 |
2183 |
2322 |
2160 |
1914 |
2378 |
6 |
|
|
Imports / Consumption (%) |
Wheat |
100.00 |
100.00 |
100.00 |
100.00 |
100.00 |
100.00 |
100.00 |
0 |
|
Coarse Grains |
0.89 |
2.05 |
0.68 |
0.36 |
1.11 |
0.00 |
6.65 |
147 |
|
|
Rice |
23.38 |
55.76 |
38.64 |
41.82 |
39.81 |
0.85 |
71.34 |
44 |
|
|
Dairy |
33.48 |
50.90 |
61.77 |
62.28 |
49.63 |
20.96 |
69.58 |
29 |
|
|
Meat |
5.10 |
30.88 |
6.69 |
16.10 |
15.52 |
1.25 |
38.20 |
78 |
|
|
Sugar |
100.00 |
100.00 |
100.00 |
100.00 |
100.00 |
100.00 |
100.00 |
0 |
|
|
Fruits and Vegetables |
3.78 |
6.11 |
3.87 |
3.90 |
4.55 |
2.62 |
8.67 |
35 |
|
|
Oils |
1.35 |
6.02 |
4.88 |
7.67 |
4.66 |
0.60 |
14.33 |
80 |
|
|
Per Caput Calories from Imports (Cal/Cap/Day) |
53 |
152 |
123 |
159 |
117 |
10 |
222 |
50 |
|
|
Aid + Commercial Food Import Bill (US$ 000) |
11,935 |
51,223 |
41,715 |
42,147 |
35,461 |
4,517 |
72,533 |
57 |
|
|
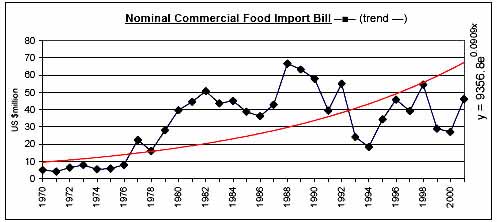
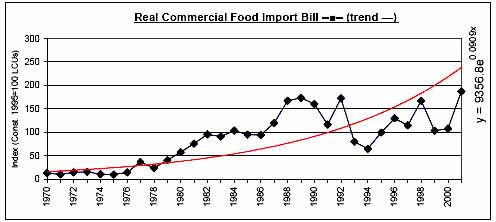
Commercial Food Import Bill (US$ 000) |
11,022 |
47,245 |
38,281 |
40,381 |
32,958 |
4,297 |
66,738 |
57 |
|
|
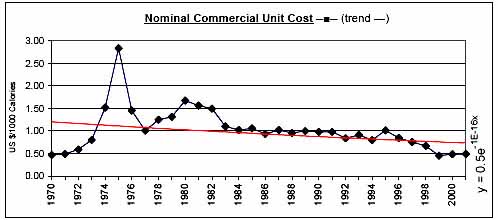
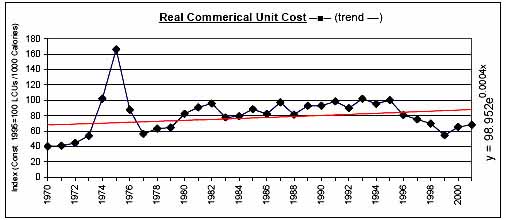
Commerical Unit Cost (US $/1000 calories) |
1.18 |
1.18 |
0.92 |
0.62 |
1.03 |
0.46 |
2.84 |
46 |
|
|
Commercial Food Import Bill / GDP (%) |
0.87 |
3.33 |
2.51 |
2.23 |
2.20 |
0.37 |
4.33 |
54 |
|
|
Comm. Fd. Imp. Bill / Total Merchandise Imp. Bill (%) |
5.90 |
12.31 |
8.59 |
9.26 |
9.04 |
3.43 |
16.63 |
41 |
|
|
Comm. Fd. Imp. Bill / Total Merchandise Exp. Bill (%) |
9.28 |
21.78 |
15.93 |
15.83 |
15.66 |
2.88 |
28.55 |
44 |
|
|
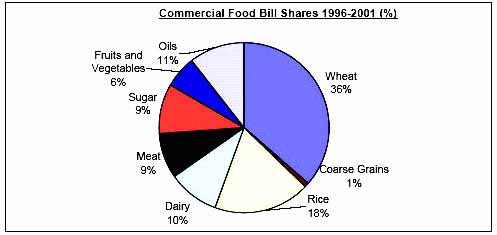
Commercial Food Value Bill Shares (%) |
Wheat |
17.82 |
18.38 |
32.35 |
36.52 |
24.22 |
1.16 |
50.40 |
45 |
|
Coarse Grains |
0.34 |
2.81 |
0.69 |
0.75 |
1.26 |
0.00 |
14.32 |
230 |
|
|
Rice |
10.10 |
14.48 |
15.29 |
18.26 |
13.97 |
0.57 |
46.09 |
54 |
|
|
Dairy |
10.48 |
7.57 |
13.33 |
9.71 |
9.96 |
4.67 |
19.36 |
34 |
|
|
Meat |
6.58 |
14.91 |
4.80 |
8.62 |
9.23 |
1.37 |
19.58 |
52 |
|
|
Sugar |
29.38 |
23.67 |
14.11 |
9.40 |
20.99 |
5.62 |
42.88 |
49 |
|
|
Fruits and Vegetables |
21.64 |
13.58 |
13.09 |
6.14 |
14.61 |
4.73 |
28.75 |
47 |
|
|
Oils |
3.66 |
4.60 |
6.34 |
10.58 |
5.75 |
0.00 |
13.37 |
64 |
|
|
|
|
|
|
|
|
|
|
![]()
![]()
![]()