![]()
![]()
![]()
|
Trinidad Tob |
Mean |
1970-2001 |
|||||||
|
1970-1979 |
1980-1989 |
1990-1995 |
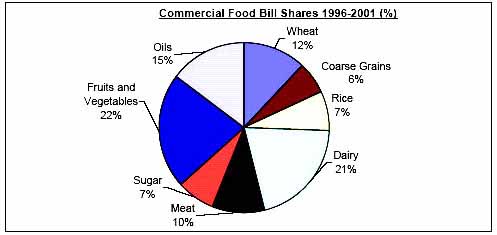
1996-2001 |
Mean |
Min. |
Max. |
Variation (%) |
||
|
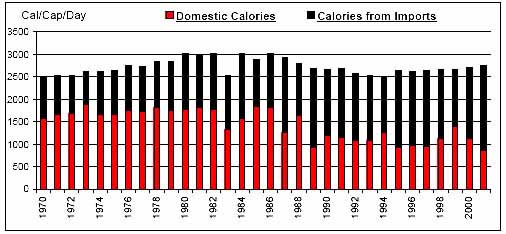
Per Caput Consumption (Cal/Day) |
2661 |
2890 |
2600 |
2677 |
2724 |
2486 |
3025 |
6 |
|
|
Imports / Consumption (%) |
Wheat |
100.00 |
100.00 |
100.00 |
100.00 |
100.00 |
100.00 |
100.00 |
0 |
|
Coarse Grains |
94.28 |
96.76 |
94.78 |
91.86 |
94.70 |
83.79 |
97.60 |
3 |
|
|
Rice |
67.55 |
87.21 |
65.62 |
83.73 |
76.37 |
55.36 |
94.10 |
15 |
|
|
Dairy |
93.10 |
94.09 |
91.55 |
91.75 |
92.87 |
90.19 |
96.30 |
2 |
|
|
Meat |
30.78 |
36.29 |
25.76 |
26.84 |
30.82 |
19.09 |
45.24 |
21 |
|
|
Sugar |
0.14 |
2.86 |
0.70 |
4.06 |
1.83 |
0.00 |
7.23 |
109 |
|
|
Fruits and Vegetables |
32.06 |
55.92 |
42.95 |
46.53 |
44.27 |
24.76 |
68.98 |
26 |
|
|
Oils |
14.29 |
37.06 |
62.15 |
72.28 |
41.25 |
5.89 |
73.88 |
59 |
|
|
Per Caput Calories from Imports (Cal/Cap/Day) |
943 |
1314 |
1484 |
1606 |
1284 |
723 |
1892 |
24 |
|
|
Aid + Commercial Food Import Bill (US$ 000) |
98,019 |
242,392 |
184,970 |
212,609 |
180,924 |
43,258 |
301,116 |
38 |
|
|
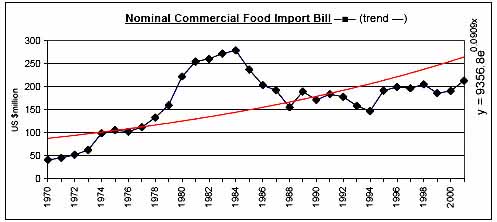
Commercial Food Import Bill (US$ 000) |
91,500 |
226,779 |
171,925 |
198,671 |
168,949 |
41,607 |
279,373 |
38 |
|
|
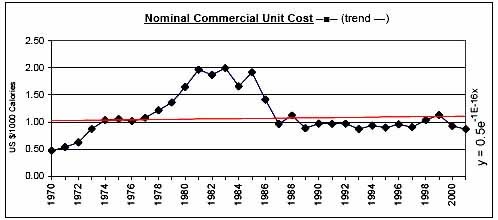
Commerical Unit Cost (US $/1000 calories) |
0.93 |
1.55 |
0.94 |
0.97 |
1.13 |
0.47 |
2.00 |
35 |
|
|
Commercial Food Import Bill / GDP (%) |
1.56 |
3.80 |
3.30 |
3.14 |
2.88 |
0.86 |
4.69 |
36 |
|
|
Comm. Fd. Imp. Bill / Total Merchandise Imp. Bill (%) |
6.71 |
12.25 |
12.06 |
6.88 |
9.48 |
5.08 |
15.78 |
37 |
|
|
Comm. Fd. Imp. Bill / Total Merchandise Exp. Bill (%) |
6.87 |
10.68 |
8.65 |
6.88 |
8.39 |
4.47 |
14.67 |
31 |
|
|
Commercial Food Value Bill Shares (%) |
Wheat |
16.57 |
9.57 |
12.38 |
12.05 |
12.75 |
6.43 |
22.17 |
31 |
|
Coarse Grains |
9.26 |
7.31 |
7.63 |
6.09 |
7.75 |
3.99 |
12.73 |
27 |
|
|
Rice |
11.55 |
8.77 |
7.23 |
7.34 |
9.08 |
3.18 |
17.07 |
29 |
|
|
Dairy |
18.79 |
20.66 |
22.01 |
20.57 |
20.31 |
14.06 |
24.59 |
11 |
|
|
Meat |
15.82 |
15.60 |
10.20 |
10.07 |
13.62 |
7.73 |
20.22 |
28 |
|
|
Sugar |
1.18 |
4.08 |
1.73 |
7.27 |
3.33 |
0.00 |
10.07 |
80 |
|
|
Fruits and Vegetables |
19.06 |
26.61 |
21.78 |
21.85 |
22.45 |
13.31 |
34.38 |
21 |
|
|
Oils |
7.76 |
7.40 |
17.04 |
14.75 |
10.70 |
4.02 |
21.44 |
48 |
|
|
|
|
|
|
|
|
|
|
![]()
![]()
![]()