![]()
![]()
![]()
|
Tunisia |
Mean |
1970-2001 |
|||||||
|
1970-1979 |
1980-1989 |
1990-1995 |
1996-2001 |
Mean |
Min. |
Max. |
Variation (%) |
||
|
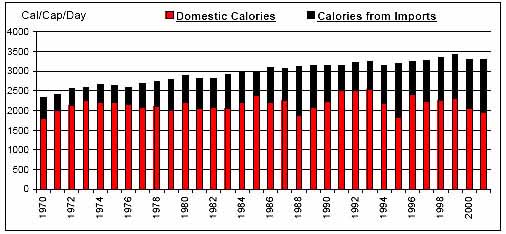
Per Caput Consumption (Cal/Day) |
2596 |
2985 |
3183 |
3315 |
2963 |
2323 |
3428 |
10 |
|
|
Imports / Consumption (%) |
Wheat |
34.26 |
52.44 |
45.58 |
50.09 |
45.03 |
20.30 |
86.00 |
38 |
|
Coarse Grains |
25.23 |
50.86 |
53.23 |
67.50 |
46.42 |
5.31 |
90.64 |
55 |
|
|
Rice |
100.00 |
100.00 |
100.00 |
100.00 |
100.00 |
100.00 |
100.00 |
0 |
|
|
Dairy |
31.28 |
40.08 |
26.50 |
8.72 |
28.90 |
5.24 |
49.50 |
42 |
|
|
Meat |
2.23 |
8.46 |
6.91 |
1.80 |
4.97 |
0.03 |
18.72 |
79 |
|
|
Sugar |
71.97 |
56.08 |
46.36 |
72.46 |
62.30 |
38.98 |
100.00 |
26 |
|
|
Fruits and Vegetables |
1.87 |
2.43 |
2.64 |
3.07 |
2.42 |
0.83 |
6.04 |
44 |
|
|
Oils |
7.96 |
17.00 |
18.52 |
16.70 |
14.40 |
2.44 |
34.41 |
52 |
|
|
Per Caput Calories from Imports (Cal/Cap/Day) |
503 |
846 |
885 |
1115 |
796 |
343 |
1369 |
36 |
|
|
Aid + Commercial Food Import Bill (US$ 000) |
158,016 |
372,866 |
456,452 |
546,008 |
353,862 |
63,341 |
780,364 |
50 |
|
|
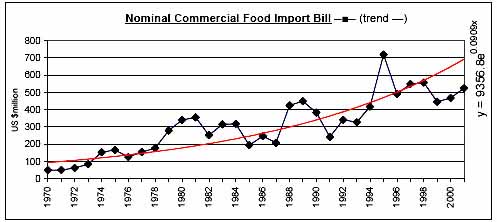
Commercial Food Import Bill (US$ 000) |
131,152 |
311,059 |
405,746 |
506,297 |
309,199 |
50,402 |
720,034 |
54 |
|
|
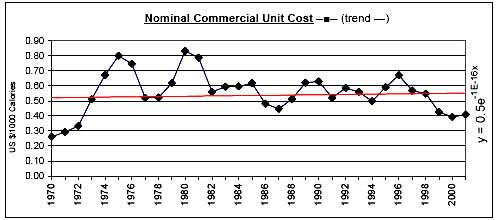
Commerical Unit Cost (US $/1000 calories) |
0.53 |
0.61 |
0.57 |
0.50 |
0.55 |
0.26 |
0.83 |
25 |
|
|
Commercial Food Import Bill / GDP (%) |
2.02 |
3.09 |
2.92 |
2.81 |
2.67 |
1.09 |
4.84 |
33 |
|
|
Comm. Fd. Imp. Bill / Total Merchandise Imp. Bill (%) |
11.86 |
9.06 |
6.29 |
6.03 |
8.85 |
4.67 |
16.50 |
35 |
|
|
Comm. Fd. Imp. Bill / Total Merchandise Exp. Bill (%) |
19.29 |
14.44 |
9.47 |
8.67 |
13.94 |
6.54 |
27.62 |
37 |
|
|
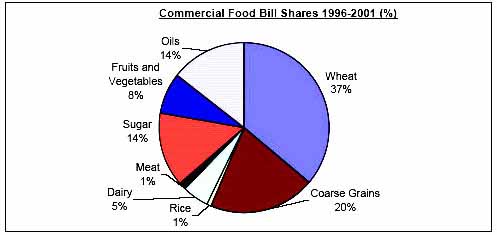
Commercial Food Value Bill Shares (%) |
Wheat |
27.38 |
33.23 |
28.69 |
36.07 |
31.08 |
13.98 |
42.41 |
25 |
|
Coarse Grains |
6.53 |
12.10 |
13.08 |
20.20 |
12.06 |
1.28 |
30.22 |
56 |
|
|
Rice |
0.70 |
0.62 |
0.90 |
0.91 |
0.75 |
0.02 |
1.64 |
57 |
|
|
Dairy |
13.47 |
13.80 |
12.06 |
4.93 |
11.71 |
3.81 |
20.44 |
37 |
|
|
Meat |
1.66 |
5.59 |
5.43 |
1.47 |
3.56 |
0.04 |
10.16 |
77 |
|
|
Sugar |
27.71 |
14.89 |
17.63 |
14.09 |
19.26 |
8.35 |
47.35 |
45 |
|
|
Fruits and Vegetables |
5.86 |
5.83 |
6.96 |
7.88 |
6.44 |
3.69 |
10.53 |
27 |
|
|
Oils |
16.69 |
13.95 |
15.25 |
14.45 |
15.14 |
4.07 |
25.78 |
34 |
|
|
|
|
|
|
|
|
|
|
![]()
![]()
![]()