![]()
![]()
![]()
|
Uganda |
Mean |
1970-2001 |
|||||||
|
1970-1979 |
1980-1989 |
1990-1995 |
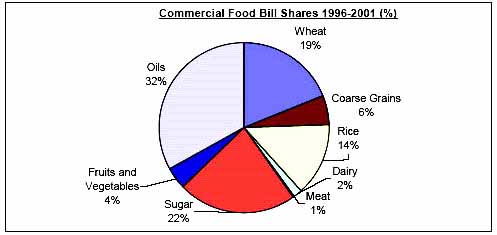
1996-2001 |
Mean |
Min. |
Max. |
Variation (%) |
||
|
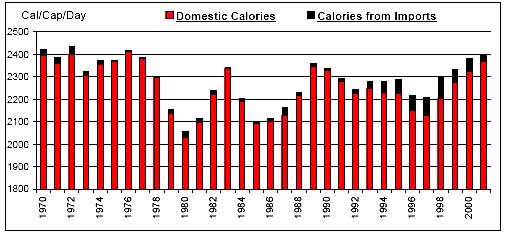
Per Caput Consumption (Cal/Day) |
2357 |
2193 |
2286 |
2306 |
2283 |
2058 |
2434 |
5 |
|
|
Imports / Consumption (%) |
Wheat |
45.49 |
52.91 |
79.80 |
84.28 |
61.51 |
0.00 |
92.03 |
45 |
|
Coarse Grains |
0.17 |
1.07 |
1.05 |
2.82 |
1.11 |
0.00 |
7.54 |
156 |
|
|
Rice |
17.38 |
23.53 |
4.08 |
26.22 |
18.47 |
0.00 |
46.88 |
71 |
|
|
Dairy |
7.48 |
6.89 |
2.20 |
0.88 |
5.07 |
0.32 |
13.50 |
74 |
|
|
Meat |
0.22 |
0.19 |
0.10 |
0.09 |
0.16 |
0.00 |
0.69 |
104 |
|
|
Sugar |
1.75 |
4.60 |
2.60 |
2.65 |
2.97 |
0.00 |
18.11 |
135 |
|
|
Fruits and Vegetables |
0.03 |
0.01 |
0.08 |
0.10 |
0.05 |
0.00 |
0.21 |
128 |
|
|
Oils |
0.89 |
1.65 |
8.12 |
18.59 |
5.80 |
0.00 |
25.96 |
133 |
|
|
Per Caput Calories from Imports (Cal/Cap/Day) |
16 |
16 |
30 |
66 |
28 |
1 |
94 |
85 |
|
|
Aid + Commercial Food Import Bill (US$ 000) |
13,886 |
27,949 |
58,052 |
120,019 |
46,462 |
2,910 |
201,779 |
103 |
|
|
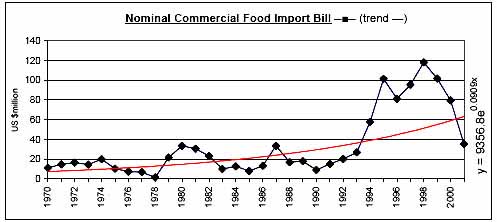
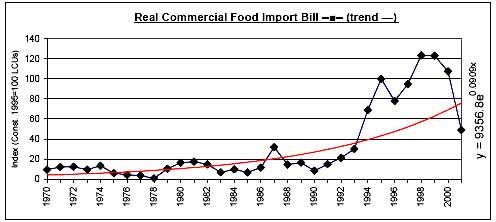
Commercial Food Import Bill (US$ 000) |
12,432 |
19,983 |
38,367 |
85,210 |
33,300 |
1,576 |
118,250 |
99 |
|
|
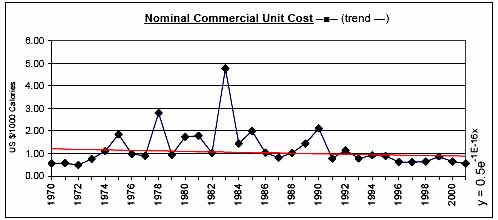
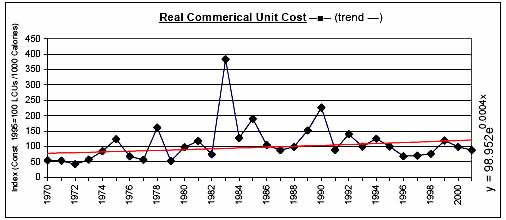
Commerical Unit Cost (US $/1000 calories) |
1.10 |
1.71 |
1.11 |
0.66 |
1.21 |
0.50 |
4.79 |
70 |
|
|
Commercial Food Import Bill / GDP (%) |
0.37 |
0.55 |
0.65 |
1.07 |
0.61 |
0.04 |
1.55 |
66 |
|
|
Comm. Fd. Imp. Bill / Total Merchandise Imp. Bill (%) |
6.01 |
4.58 |
4.66 |
6.18 |
5.34 |
0.56 |
9.82 |
49 |
|
|
Comm. Fd. Imp. Bill / Total Merchandise Exp. Bill (%) |
3.92 |
6.08 |
11.37 |
16.03 |
8.26 |
0.45 |
23.16 |
71 |
|
|
Commercial Food Value Bill Shares (%) |
Wheat |
14.73 |
3.86 |
15.78 |
18.82 |
12.30 |
0.00 |
44.53 |
100 |
|
Coarse Grains |
2.15 |
6.35 |
5.50 |
5.69 |
4.75 |
0.00 |
49.02 |
218 |
|
|
Rice |
8.61 |
13.69 |
2.83 |
13.78 |
10.08 |
0.00 |
24.87 |
73 |
|
|
Dairy |
37.34 |
36.81 |
14.38 |
1.61 |
26.17 |
1.03 |
88.58 |
87 |
|
|
Meat |
2.05 |
3.13 |
0.85 |
0.51 |
1.87 |
0.00 |
12.44 |
139 |
|
|
Sugar |
18.86 |
28.96 |
32.44 |
22.35 |
25.22 |
0.00 |
74.31 |
90 |
|
|
Fruits and Vegetables |
7.15 |
1.53 |
8.18 |
4.08 |
5.01 |
0.00 |
19.67 |
104 |
|
|
Oils |
9.11 |
5.68 |
20.04 |
33.16 |
14.60 |
0.00 |
42.98 |
96 |
|
|
|
|
|
|
|
|
|
|
![]()
![]()
![]()