![]()
![]()
![]()
|
Vanuatu |
Mean |
1970-2001 |
|||||||
|
1970-1979 |
1980-1989 |
1990-1995 |
1996-2001 |
Mean |
Min. |
Max. |
Variation (%) |
||
|
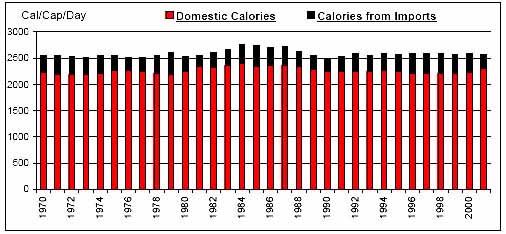
Per Caput Consumption (Cal/Day) |
2539 |
2645 |
2553 |
2580 |
2583 |
2492 |
2748 |
3 |
|
|
Imports / Consumption (%) |
Wheat |
100.00 |
100.00 |
100.00 |
100.00 |
100.00 |
100.00 |
100.00 |
0 |
|
Coarse Grains |
2.55 |
0.85 |
0.27 |
0.09 |
1.13 |
0.00 |
6.37 |
153 |
|
|
Rice |
100.00 |
100.00 |
100.00 |
100.00 |
100.00 |
100.00 |
100.00 |
0 |
|
|
Dairy |
48.13 |
45.26 |
31.17 |
33.99 |
41.40 |
28.59 |
73.21 |
24 |
|
|
Meat |
16.29 |
9.49 |
7.34 |
13.12 |
11.89 |
3.87 |
23.13 |
36 |
|
|
Sugar |
100.00 |
100.00 |
100.00 |
100.00 |
100.00 |
100.00 |
100.00 |
0 |
|
|
Fruits and Vegetables |
6.93 |
4.71 |
6.52 |
8.04 |
6.37 |
0.00 |
11.52 |
50 |
|
|
Oils |
0.08 |
0.09 |
0.20 |
0.20 |
0.13 |
0.04 |
0.31 |
57 |
|
|
Per Caput Calories from Imports (Cal/Cap/Day) |
324 |
314 |
310 |
353 |
324 |
225 |
413 |
15 |
|
|
Aid + Commercial Food Import Bill (US$ 000) |
4,664 |
7,232 |
9,192 |
12,372 |
7,760 |
1,934 |
13,920 |
40 |
|
|
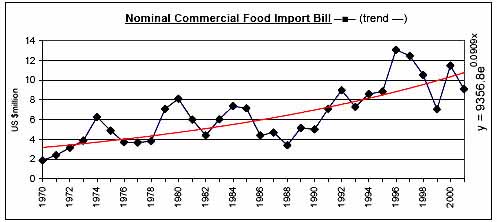
Commercial Food Import Bill (US$ 000) |
4,072 |
5,677 |
7,645 |
10,619 |
6,471 |
1,871 |
13,079 |
44 |
|
|
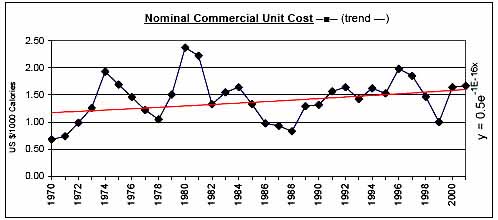
Commerical Unit Cost (US $/1000 calories) |
1.25 |
1.45 |
1.52 |
1.60 |
1.43 |
0.68 |
2.38 |
28 |
|
|
Commercial Food Import Bill / GDP (%) |
3.44 |
3.44 |
3.62 |
4.76 |
3.72 |
1.96 |
5.86 |
29 |
|
|
Comm. Fd. Imp. Bill / Total Merchandise Imp. Bill (%) |
11.74 |
8.58 |
8.90 |
11.31 |
10.14 |
4.84 |
14.51 |
26 |
|
|
Comm. Fd. Imp. Bill / Total Merchandise Exp. Bill (%) |
20.79 |
21.32 |
33.56 |
36.01 |
26.20 |
10.11 |
48.19 |
37 |
|
|
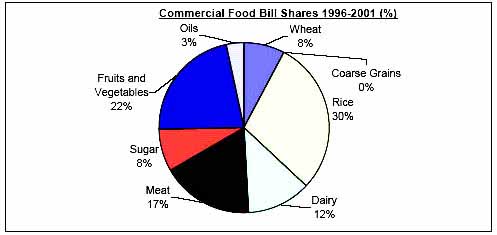
Commercial Food Value Bill Shares (%) |
Wheat |
10.08 |
13.18 |
10.95 |
7.87 |
10.80 |
3.92 |
18.18 |
34 |
|
Coarse Grains |
0.10 |
0.10 |
0.04 |
0.02 |
0.07 |
0.00 |
0.26 |
111 |
|
|
Rice |
24.01 |
19.47 |
26.72 |
29.12 |
24.06 |
0.00 |
41.40 |
54 |
|
|
Dairy |
11.04 |
14.86 |
12.64 |
12.09 |
12.73 |
9.52 |
22.62 |
25 |
|
|
Meat |
27.86 |
18.39 |
15.33 |
17.46 |
20.60 |
12.01 |
44.25 |
34 |
|
|
Sugar |
12.64 |
12.92 |
9.44 |
8.13 |
11.28 |
6.47 |
26.29 |
37 |
|
|
Fruits and Vegetables |
11.20 |
17.63 |
20.80 |
22.01 |
17.04 |
0.00 |
32.99 |
41 |
|
|
Oils |
3.06 |
3.45 |
4.08 |
3.31 |
3.42 |
1.68 |
6.72 |
29 |
|
|
|
|
|
|
|
|
|
|
![]()
![]()
![]()