![]()
![]()
![]()
|
Venezuela |
Mean |
1970-2001 |
|||||||
|
1970-1979 |
1980-1989 |
1990-1995 |
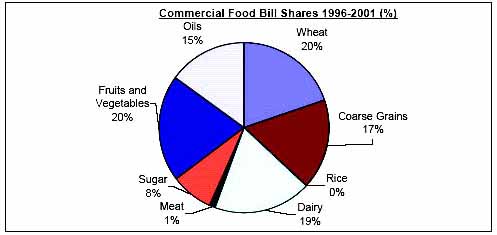
1996-2001 |
Mean |
Min. |
Max. |
Variation (%) |
||
|
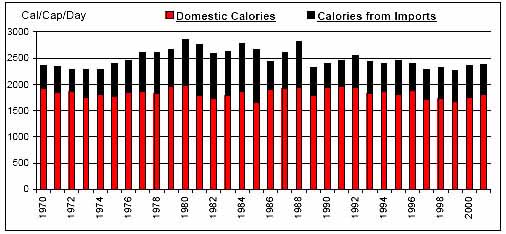
Per Caput Consumption (Cal/Day) |
2428 |
2644 |
2445 |
2333 |
2481 |
2257 |
2846 |
7 |
|
|
Imports / Consumption (%) |
Wheat |
99.91 |
99.96 |
99.97 |
99.95 |
99.95 |
99.87 |
99.97 |
0 |
|
Coarse Grains |
48.23 |
52.54 |
34.45 |
39.41 |
45.34 |
16.61 |
69.16 |
29 |
|
|
Rice |
0.65 |
2.13 |
1.74 |
0.31 |
1.25 |
0.00 |
13.83 |
227 |
|
|
Dairy |
22.26 |
29.72 |
22.39 |
29.06 |
25.89 |
5.26 |
47.38 |
39 |
|
|
Meat |
3.35 |
2.26 |
0.40 |
0.45 |
1.91 |
0.01 |
11.87 |
151 |
|
|
Sugar |
2.16 |
4.81 |
3.63 |
3.92 |
3.59 |
0.00 |
10.69 |
77 |
|
|
Fruits and Vegetables |
5.92 |
5.87 |
7.29 |
7.74 |
6.50 |
2.10 |
9.71 |
28 |
|
|
Oils |
34.74 |
50.50 |
49.83 |
54.55 |
46.21 |
20.20 |
66.32 |
25 |
|
|
Per Caput Calories from Imports (Cal/Cap/Day) |
584 |
810 |
562 |
574 |
648 |
422 |
1005 |
25 |
|
|
Aid + Commercial Food Import Bill (US$ 000) |
464,423 |
946,406 |
799,376 |
992,835 |
776,923 |
123,428 |
1,467,655 |
44 |
|
|
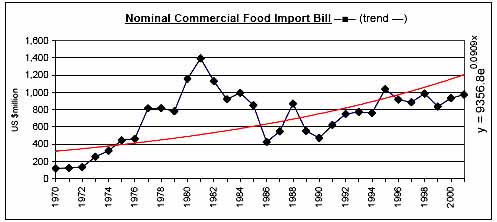
Commercial Food Import Bill (US$ 000) |
429,173 |
886,644 |
737,622 |
923,701 |
722,691 |
120,305 |
1,395,226 |
44 |
|
|
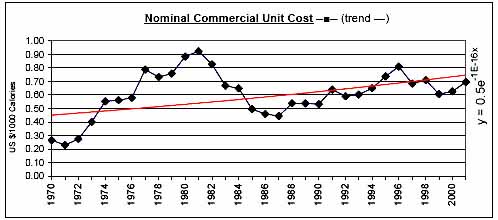
Commerical Unit Cost (US $/1000 calories) |
0.51 |
0.64 |
0.63 |
0.69 |
0.61 |
0.23 |
0.92 |
28 |
|
|
Commercial Food Import Bill / GDP (%) |
1.07 |
2.00 |
1.34 |
1.55 |
1.50 |
0.40 |
3.16 |
43 |
|
|
Comm. Fd. Imp. Bill / Total Merchandise Imp. Bill (%) |
7.85 |
9.98 |
7.07 |
6.48 |
8.11 |
4.95 |
14.98 |
30 |
|
|
Comm. Fd. Imp. Bill / Total Merchandise Exp. Bill (%) |
5.30 |
6.53 |
4.57 |
4.17 |
5.34 |
2.70 |
8.83 |
31 |
|
|
Commercial Food Value Bill Shares (%) |
Wheat |
26.45 |
21.27 |
25.03 |
19.59 |
23.28 |
11.97 |
35.98 |
31 |
|
Coarse Grains |
20.62 |
23.08 |
14.34 |
17.28 |
19.58 |
6.61 |
30.61 |
29 |
|
|
Rice |
0.18 |
0.35 |
0.45 |
0.01 |
0.25 |
0.00 |
2.13 |
209 |
|
|
Dairy |
11.10 |
15.69 |
16.10 |
18.80 |
14.91 |
4.36 |
24.87 |
32 |
|
|
Meat |
4.56 |
3.03 |
0.60 |
0.85 |
2.64 |
0.04 |
13.93 |
129 |
|
|
Sugar |
4.45 |
11.22 |
9.46 |
8.21 |
8.21 |
0.00 |
21.59 |
70 |
|
|
Fruits and Vegetables |
17.28 |
10.00 |
16.75 |
20.25 |
15.46 |
8.37 |
25.11 |
33 |
|
|
Oils |
15.36 |
15.37 |
17.27 |
15.01 |
15.66 |
7.16 |
22.49 |
25 |
|
|
|
|
|
|
|
|
|
|
![]()
![]()
![]()