![]()
![]()
![]()
|
Yemen |
Mean |
1970-2001 |
|||||||
|
1970-1979 |
1980-1989 |
1990-1995 |
1996-2001 |
Mean |
Min. |
Max. |
Variation (%) |
||
|
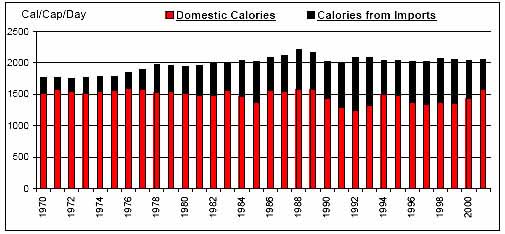
Per Caput Consumption (Cal/Day) |
1830 |
2053 |
2042 |
2043 |
1979 |
1756 |
2210 |
6 |
|
|
Imports / Consumption (%) |
Wheat |
79.74 |
90.15 |
90.85 |
92.85 |
87.53 |
68.71 |
94.15 |
8 |
|
Coarse Grains |
1.59 |
2.70 |
14.99 |
19.41 |
7.79 |
0.21 |
28.64 |
113 |
|
|
Rice |
100.00 |
100.00 |
100.00 |
100.00 |
100.00 |
100.00 |
100.00 |
0 |
|
|
Dairy |
46.35 |
64.87 |
49.08 |
52.61 |
53.82 |
25.46 |
70.68 |
23 |
|
|
Meat |
11.39 |
24.20 |
14.63 |
18.84 |
17.40 |
0.46 |
46.63 |
77 |
|
|
Sugar |
98.18 |
100.00 |
100.00 |
100.00 |
99.43 |
95.33 |
100.00 |
1 |
|
|
Fruits and Vegetables |
13.46 |
14.09 |
5.90 |
5.97 |
10.83 |
3.48 |
27.97 |
65 |
|
|
Oils |
40.08 |
74.09 |
84.23 |
78.88 |
66.26 |
28.35 |
87.70 |
30 |
|
|
Per Caput Calories from Imports (Cal/Cap/Day) |
281 |
539 |
662 |
638 |
500 |
184 |
839 |
36 |
|
|
Aid + Commercial Food Import Bill (US$ 000) |
194,503 |
503,535 |
643,531 |
686,039 |
467,431 |
41,888 |
984,123 |
50 |
|
|
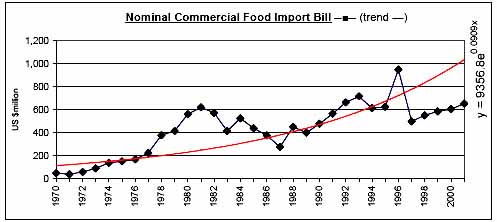
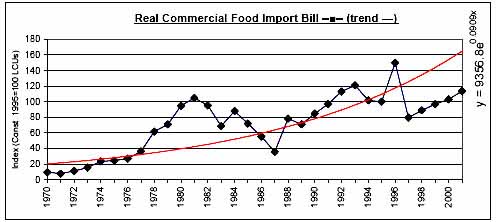
Commercial Food Import Bill (US$ 000) |
169,098 |
461,641 |
608,126 |
638,312 |
430,813 |
37,191 |
946,985 |
52 |
|
|
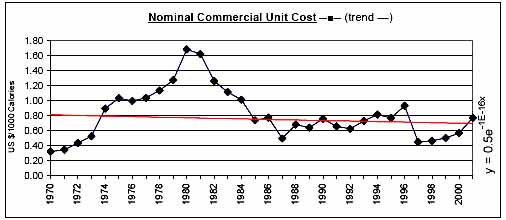
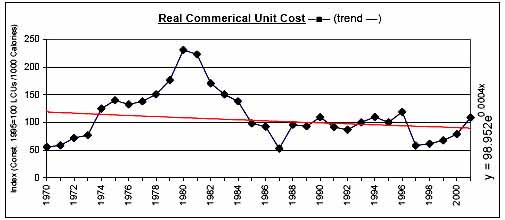
Commerical Unit Cost (US $/1000 calories) |
0.80 |
1.00 |
0.73 |
0.62 |
0.82 |
0.32 |
1.69 |
41 |
|
|
Commercial Food Import Bill / GDP (%) |
5.02 |
6.99 |
5.56 |
3.88 |
5.53 |
1.88 |
11.32 |
44 |
|
|
Comm. Fd. Imp. Bill / Total Merchandise Imp. Bill (%) |
21.11 |
18.96 |
31.09 |
32.66 |
24.47 |
13.20 |
62.64 |
39 |
|
|
Comm. Fd. Imp. Bill / Total Merchandise Exp. Bill (%) |
77.86 |
68.14 |
84.63 |
28.00 |
66.74 |
15.86 |
180.97 |
52 |
|
|
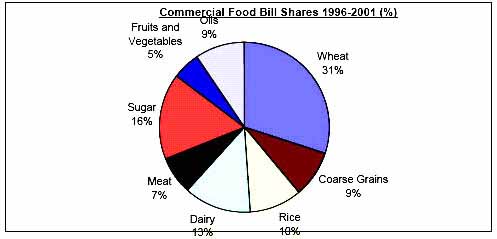
Commercial Food Value Bill Shares (%) |
Wheat |
27.98 |
29.36 |
39.27 |
29.89 |
30.89 |
19.35 |
43.86 |
21 |
|
Coarse Grains |
1.63 |
0.67 |
2.87 |
9.00 |
2.94 |
0.00 |
38.42 |
226 |
|
|
Rice |
7.76 |
6.57 |
7.82 |
9.95 |
7.81 |
0.00 |
16.82 |
47 |
|
|
Dairy |
11.92 |
18.05 |
11.86 |
12.89 |
14.00 |
5.12 |
24.09 |
29 |
|
|
Meat |
4.59 |
9.60 |
6.03 |
7.14 |
6.90 |
0.25 |
17.44 |
71 |
|
|
Sugar |
22.02 |
14.07 |
16.42 |
16.48 |
17.45 |
3.22 |
34.02 |
39 |
|
|
Fruits and Vegetables |
16.10 |
14.10 |
8.30 |
5.30 |
11.99 |
3.34 |
29.87 |
62 |
|
|
Oils |
8.01 |
7.58 |
7.43 |
9.35 |
8.02 |
3.90 |
13.02 |
31 |
|
|
|
|
|
|
|
|
|
|
![]()
![]()
![]()