![]()
![]()
|
Zambia |
Mean |
1970-2001 |
|||||||
|
1970-1979 |
1980-1989 |
1990-1995 |
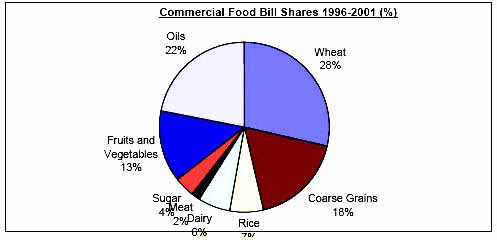
1996-2001 |
Mean |
Min. |
Max. |
Variation (%) |
||
|
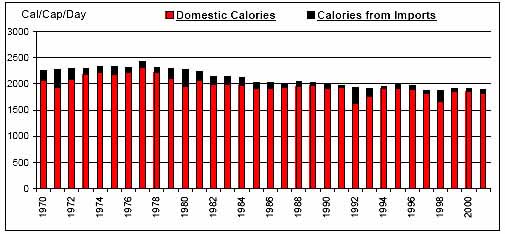
Per Caput Consumption (Cal/Day) |
2308 |
2100 |
1958 |
1900 |
2101 |
1869 |
2420 |
8 |
|
|
Imports / Consumption (%) |
Wheat |
97.53 |
76.14 |
37.22 |
46.19 |
69.91 |
15.10 |
99.91 |
39 |
|
Coarse Grains |
4.02 |
10.06 |
15.92 |
8.23 |
8.93 |
0.00 |
55.50 |
131 |
|
|
Rice |
81.97 |
35.73 |
27.71 |
42.51 |
49.95 |
0.00 |
93.61 |
54 |
|
|
Dairy |
48.20 |
14.28 |
7.61 |
13.28 |
23.44 |
2.08 |
73.67 |
82 |
|
|
Meat |
7.86 |
0.01 |
0.08 |
0.35 |
2.54 |
0.00 |
20.93 |
214 |
|
|
Sugar |
1.86 |
0.03 |
0.04 |
0.49 |
0.69 |
0.00 |
6.91 |
226 |
|
|
Fruits and Vegetables |
2.89 |
0.23 |
0.90 |
4.46 |
1.98 |
0.04 |
8.49 |
114 |
|
|
Oils |
20.57 |
14.78 |
13.57 |
17.17 |
16.81 |
3.78 |
34.57 |
47 |
|
|
Per Caput Calories from Imports (Cal/Cap/Day) |
159 |
139 |
118 |
86 |
131 |
29 |
345 |
61 |
|
|
Aid + Commercial Food Import Bill (US$ 000) |
44,660 |
51,927 |
53,827 |
78,275 |
54,952 |
16,947 |
163,823 |
58 |
|
|
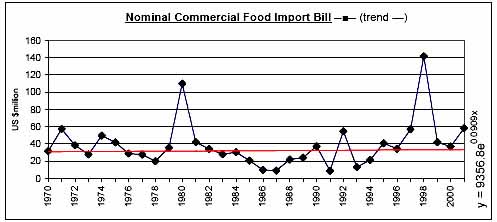
Commercial Food Import Bill (US$ 000) |
35,943 |
33,064 |
29,384 |
61,777 |
38,657 |
8,833 |
141,698 |
70 |
|
|
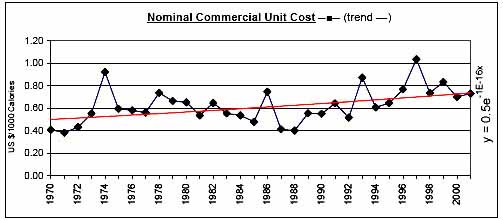
Commerical Unit Cost (US $/1000 calories) |
0.58 |
0.55 |
0.64 |
0.80 |
0.62 |
0.38 |
1.04 |
25 |
|
|
Commercial Food Import Bill / GDP (%) |
1.12 |
0.95 |
0.83 |
1.76 |
1.13 |
0.24 |
4.14 |
70 |
|
|
Comm. Fd. Imp. Bill / Total Merchandise Imp. Bill (%) |
5.64 |
3.84 |
3.19 |
8.80 |
5.21 |
1.07 |
21.80 |
73 |
|
|
Comm. Fd. Imp. Bill / Total Merchandise Exp. Bill (%) |
3.88 |
3.29 |
2.55 |
6.66 |
3.97 |
0.71 |
18.17 |
80 |
|
|
Commercial Food Value Bill Shares (%) |
Wheat |
25.50 |
22.98 |
21.14 |
28.65 |
24.49 |
0.00 |
58.93 |
56 |
|
Coarse Grains |
8.33 |
45.58 |
35.31 |
17.67 |
26.78 |
0.00 |
77.09 |
100 |
|
|
Rice |
5.82 |
6.44 |
7.07 |
6.56 |
6.38 |
0.00 |
16.53 |
68 |
|
|
Dairy |
19.45 |
8.65 |
8.23 |
6.14 |
11.48 |
1.38 |
33.59 |
70 |
|
|
Meat |
12.91 |
0.06 |
0.83 |
1.65 |
4.52 |
0.00 |
30.64 |
183 |
|
|
Sugar |
2.53 |
0.62 |
1.71 |
3.87 |
2.03 |
0.00 |
11.91 |
141 |
|
|
Fruits and Vegetables |
7.25 |
1.43 |
6.74 |
13.42 |
6.49 |
0.00 |
22.52 |
95 |
|
|
Oils |
18.21 |
14.24 |
18.98 |
22.05 |
17.83 |
0.00 |
37.96 |
50 |
|
|
|
|
|
|
|
|
|
|
![]()
![]()