![]()
![]()
![]()
The source for the data in this table is the FAO's statistical data-base, FAOSTAT. This covers production and trade (imports and exports) by country for a wide range of commodities. In the case of NTAEs, the main categories covered by the analysis in this section are fruits and vegetables, speciality products (ginger, chillies, garlic, cut flowers etc.) and processed products (juices, canned fruits and vegetables, tomato paste etc.). Data for total world trade are presented for fruits and vegetables. Data are presented for the 10 year period 1992 to 2001.
Annex tables A2.1 to A2.10 outline import, export and production data for fruits and vegetables (by volume and value) for selected countries and for the world. Tables A2.11 onwards present detailed export data by product for avocados, apples etc.
The analysis that follows focuses solely on trade in NTAEs. Some countries are very substantial producers of NTAEs, and of fruits and vegetables in particular, but export comparatively little. For example, China and India between them account for close to 25 percent of global fruit production. Both countries only export a relatively small percentage of what they produce and this is particularly true in the case of India.
Tables 2.1 and 2.2 depict the trend in the value and volume of world fruit and vegetable exports during the ten year period between 1992 and 2001. A more detailed breakdown is presented in annex tables A1.1 to A1.4.
Table 2.1: Total value of world trade in NTAEs - fruit and vegetables exports, 1992-2001
| |
|
1992 |
1993 |
1994 |
1995 |
1996 |
1997 |
1998 |
1999 |
2000 |
2001 |
|
million US$ |
|||||||||||
|
Fruit |
World Total |
10 673 |
10 446 |
11 542 |
12 989 |
13 793 |
13 953 |
13 364 |
13 269 |
13 628 |
13 826 |
|
of which: |
6 158 |
5 911 |
6 308 |
7 267 |
7 957 |
8 037 |
7 933 |
7 963 |
7 971 |
8 257 |
|
|
Fruit excluding |
World Total |
5 328 |
5 267 |
5 848 |
6 693 |
7 338 |
7 320 |
6 989 |
7 259 |
7 810 |
7 945 |
|
bananas and citrus |
of which: |
2 387 |
2 391 |
2 527 |
3 029 |
3 459 |
3 381 |
3 450 |
3 664 |
3 950 |
4 179 |
|
Vegetables |
World Total |
3 867 |
4 545 |
5 226 |
6 105 |
5 988 |
6 303 |
6 932 |
6 625 |
7 050 |
7 563 |
|
of which: |
2 025 |
2 507 |
2 790 |
3 469 |
3 282 |
3 416 |
3 894 |
3 765 |
4 057 |
4 427 |
|
|
Total fruit and vegetables |
World Total |
14 541 |
14 991 |
16 768 |
19 094 |
19 781 |
20 256 |
20295 |
19894 |
20678 |
21389 |
|
of which |
8 183 |
8 418 |
9 098 |
10 736 |
11 238 |
11 453 |
11 827 |
11 728 |
12 028 |
12 684 |
|
|
Total fruits and vegetables excluding bananas and citrus |
World Total |
9 195 |
9 813 |
11074 |
12798 |
13326 |
13622 |
13920 |
13884 |
14860 |
15508 |
|
of which |
4 412 |
4 898 |
5 316 |
6 498 |
6 741 |
6 797 |
7 343 |
7 429 |
8 007 |
8 606 |
|
Source: FAOSTAT
Note: Data excludes Intra-EC trade.
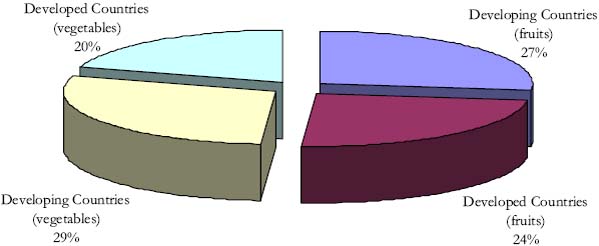
By 2001, the value of total world trade in all fruits and vegetables had reached US$21.4 billion (Table 2.1), of which US$13.8 billion was in fruits and US$7.6 billion in vegetables. Excluding bananas and citrus, total world trade in fruits and vegetables was worth US$15.5 billion. The value of developing countries' exports rose by US$4.5 billion overall, of which US$1.8 billion was accounted for by exports of fruits other than bananas and citrus. This compares with a more modest US$2.3 billion rise in the value of exports from developed country origins. Developing countries now account for close to 60 percent of the world's fruit and vegetable exports, by value, as Figure 2.1 illustrates.
In 1992, bananas and citrus accounted for 50 percent of world trade in fruits. Over the period, however, the share of bananas and citrus in total world fruit trade has fallen progressively, accounting for 43 percent of all fruit entering world trade by 2001. Figure 2.1 presents the share held by developed and developing countries in world exports of non-traditional fruits (i.e. excluding bananas and citrus) and vegetables. Developing countries' combined share of fruit and vegetables exports amounted to 56 percent (60 percent including bananas and citrus).
Figure 2.1: Share of developing and developed countries
in world exports of fruits
(excluding bananas and citrus) and
vegetables, by value, 2001 (%)
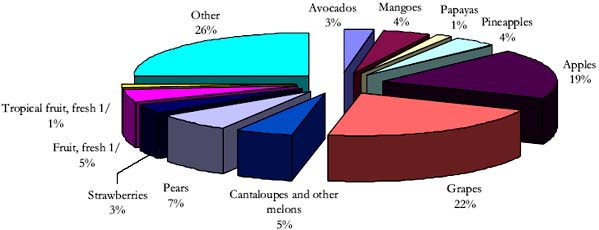
Figures 2.2 and 2.3 present the share of individual fruits and vegetables in these category totals for the final year of the data, 2001.
Three fruits - apples, grapes and pears - account for close to 50 percent of world trade by value. Grapes, in particular, have increased their share of world trade, up from 17 percent in 1992 to 22 percent in 2001. The combined value of trade in tropical fruits (avocados, mangoes, papayas, pineapples and other tropical fruits) is still fairly small by comparison, at just over 13 percent. Around one quarter of world trade is accounted for by the "other fruit" category, which includes stone-fruit, kiwi-fruit and an increasing range of berries.
Figure 2.2: Share of selected fruits in world exports by
value, excluding bananas
and citrus, 2001 (%)
1/ Not specified elsewhere.
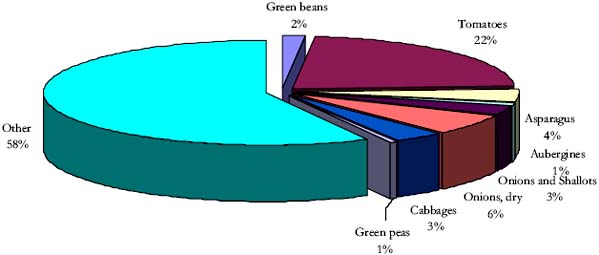
Close to 60 percent of all trade in vegetables is in the "other vegetable" category, which covers a wide range of green vegetables, salads and root vegetables, pumpkins/squashes etc. Individually, tomatoes are by far the most important traded vegetable, accounting for 22 percent of world trade by value.
Figure 2.3: Share of selected vegetables in world exports by value, 2001 (%)
The total volume of all fruit and vegetables entering world trade also rose sharply during this ten year period, up from 31.3 million tonnes in 1992, to 47.0 million tonnes by 2001 (Table 2.2). The volume share of vegetables in total world trade also increased significantly: from 24 percent in 1992 to 30 percent in 2001. Trade in fruits still accounted for over two-thirds of total trade by volume in 2001, equivalent to around 33.1 million tonnes. Of this, 19.6 million tonnes was contributed by trade in bananas and citrus fruits. However, the share of bananas and citrus in the total world fruit trade has declined over the past ten years. For example, these two fruits categories accounted for 66 percent of world fruit trade by volume in 1992, by 2001 this had fallen to 59 percent.
Table 2.2: Total volume of world trade in NTAEs - fruit and vegetables exports, 1992-2001
| |
|
1992 |
1993 |
1994 |
1995 |
1996 |
1997 |
1998 |
1999 |
2000 |
2001 |
|
'000 tonnes |
|||||||||||
|
Fruit |
World Total |
23 774 |
25 074 |
27 073 |
27 837 |
29 278 |
30 752 |
30 261 |
30 645 |
32 337 |
33 104 |
|
of which: |
|
|
|
|
|
|
|
|
|
|
|
|
Developing |
16 792 |
17 466 |
18 532 |
19 447 |
20 926 |
21 591 |
21 722 |
22 201 |
22 676 |
23 483 |
|
|
Developed |
6 982 |
7 608 |
8 540 |
8 390 |
8 351 |
9 161 |
8 539 |
8 445 |
9 660 |
9 621 |
|
| |
|
|
|
|
|
|
|
|
|
|
|
|
Fruit excluding bananas and citrus |
World Total |
8 196 |
8 799 |
9 529 |
9 781 |
10 955 |
11 509 |
11 333 |
12 078 |
13 150 |
13 462 |
|
of which: |
|
|
|
|
|
|
|
|
|
|
|
|
Developing |
4 436 |
4 748 |
5 059 |
5 344 |
6 248 |
6 380 |
6 788 |
7 225 |
7 535 |
7 998 |
|
|
Developed |
3 760 |
4 051 |
4 471 |
4 437 |
4 707 |
5 129 |
4 546 |
4 853 |
5 614 |
5 464 |
|
| |
|
|
|
|
|
|
|
|
|
|
|
|
Vegetables |
World Total |
7 557 |
8 836 |
10 028 |
10 671 |
11 223 |
11 627 |
12 860 |
13 254 |
13 089 |
13 942 |
|
of which: |
|
|
|
|
|
|
|
|
|
|
|
|
Developing |
4 255 |
5 303 |
5 652 |
6 370 |
6 753 |
6 701 |
7 965 |
7 867 |
7 747 |
8 800 |
|
|
Developed |
3 302 |
3 533 |
4 376 |
4 301 |
4 469 |
4 925 |
4 895 |
5 387 |
5 342 |
5 142 |
|
| |
|
|
|
|
|
|
|
|
|
|
|
|
Total fruit and vegetables |
World Total |
31 332 |
33 911 |
37 101 |
38 508 |
40 500 |
42 379 |
43 121 |
43 899 |
45 426 |
47 046 |
|
of which: |
|
|
|
|
|
|
|
|
|
|
|
|
Developing |
21 047 |
22 769 |
24 184 |
25 817 |
27 680 |
28 293 |
29 687 |
30 067 |
30 423 |
32 283 |
|
|
Developed |
10 285 |
11 142 |
12 917 |
12 691 |
12 821 |
14 086 |
13 434 |
13 832 |
15 003 |
14 763 |
|
| |
|
|
|
|
|
|
|
|
|
|
|
|
Total fruit and vegetables |
World Total |
15 753 |
17 635 |
19 557 |
20 452 |
22 177 |
23 135 |
24 194 |
25 332 |
26 239 |
27 403 |
|
of which: |
|
|
|
|
|
|
|
|
|
|
|
|
Developing |
8 691 |
10 051 |
10 710 |
11 714 |
13 002 |
13 081 |
14 753 |
15 092 |
15 282 |
16 798 |
|
|
Developed |
7 062 |
7 585 |
8 847 |
8 738 |
9 176 |
10 054 |
9 441 |
10 240 |
10 957 |
10 606 |
|
Source: FAOSTAT
Note: Data excludes intra-EC trade
Figures 2.4 and 2.5 depict the trend in the average export value of selected fruits and vegetables for the two five year periods, 1992 to 1996 and 1997 to 2001. The aggregate value of trade has increased for many of the fruits and vegetables between these two periods. This is most marked in the case of trade in grapes and tomatoes. The average value of trade in these two products increased by 40 percent and 52 percent, respectively. Although less important in total value terms, a number of other products have witnessed strong growth. This is particularly true for many of the fruits and for asparagus. Growth in the "other vegetable" category (not shown in Figure 2.5) has also been very strong. 80 percent of the growth in the vegetable sector between these two periods has been contributed by tomatoes and "other vegetables", and amounts to close to US$1.5 billion in value terms.
Figure 2.4: Trend in value of world exports of selected
fruits: average 1992-1996
and 1997–2001
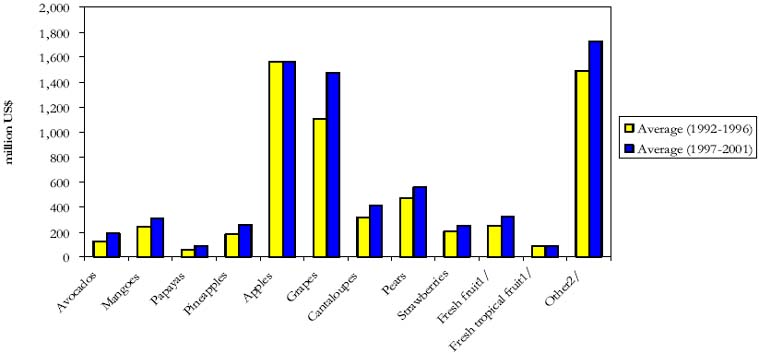
1/ Not specified elsewhere
2/ Excludes bananas and citrus
Figure 2.5: Trend in value of world exports of selected
vegetables: average 1992-1996
and 1997–2001
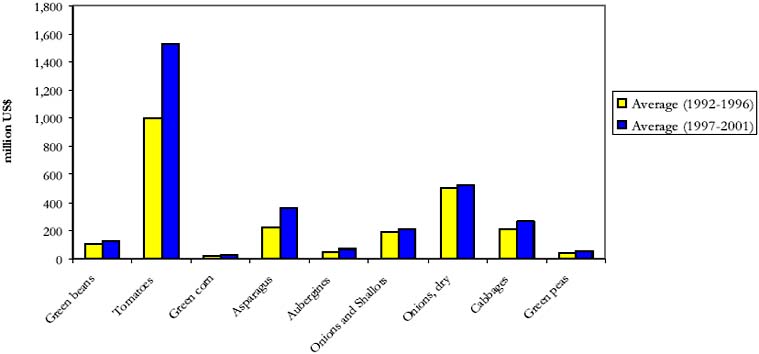
Figure 2.6 outlines the trend in the value of exports of fruit and vegetables from developed and developing countries during the two five year periods: 1992 to 1996 and 1997 to 2001. It is clear from this chart that the strongest growth in the value of world trade has been recorded by the developing countries in both product categories.
Figure 2.5: Trend in value of developing and developed
countries' exports of fruits and
vegetables, average 1992-1996 and
1997-2001
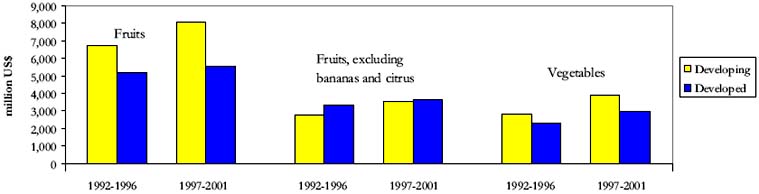
Table 2.3 illustrates the ten year trend in export values for three products (chillies and peppers, garlic and ginger) and two products (cut flowers and medicinal plants) of the speciality NTAEs category. Of the three speciality products, each has recorded an increase in total traded values between 1992 and 2001. Most significantly, there has been an almost three-fold increase in the value of trade in chillies and peppers: up from US$347 million in 1992, to US$989 million in 2001. Of this total, 52 percent of exports by value originate from developing countries. World trade in garlic is dominated by the developing countries and their share of trade has been growing at the expense of that of the developed countries during the past ten years. The 65 percent increase in the value of world trade in ginger has been captured entirely by developing country suppliers. The value of trade in cut flowers[6] has increased by US$760 million, up 25 percent on 1991. Table A1.5, in Annex 1, presents comparable data by volume.
Table 2.3: World exports of selected speciality NTAEs by value, 1992-2001
| |
|
1992 |
1993 |
1994 |
1995 |
1996 |
1997 |
1998 |
1999 |
2000 |
2001 |
|
million US$ |
|||||||||||
|
Chillies and Peppers, green |
Word Total |
347 |
389 |
406 |
501 |
476 |
605 |
704 |
678 |
843 |
989 |
|
of which: |
|
|
|
|
|
|
|
|
|
|
|
|
Developing |
187 |
206 |
198 |
267 |
222 |
306 |
351 |
335 |
450 |
517 |
|
|
Developed |
161 |
184 |
208 |
235 |
254 |
298 |
353 |
343 |
393 |
473 |
|
|
Garlic |
World Total |
225 |
292 |
257 |
305 |
353 |
356 |
400 |
432 |
323 |
405 |
|
of which: |
|
|
|
|
|
|
|
|
|
|
|
|
Developing |
186 |
247 |
219 |
259 |
298 |
294 |
324 |
373 |
273 |
350 |
|
|
Developed |
39 |
45 |
37 |
46 |
55 |
61 |
76 |
59 |
51 |
54 |
|
|
Ginger |
World Total |
75 |
85 |
90 |
130 |
146 |
136 |
101 |
112 |
126 |
124 |
|
of which: |
|
|
|
|
|
|
|
|
|
|
|
|
Developing |
70 |
80 |
85 |
126 |
141 |
131 |
95 |
107 |
122 |
119 |
|
|
Developed |
5 |
4 |
5 |
4 |
5 |
6 |
5 |
5 |
4 |
4 |
|
| |
1991 |
1992 |
1993 |
1994 |
1995 |
1996 |
1997 |
1998 |
1999 |
2000 |
|
|
million US$ |
|||||||||||
|
Cut flowers1/ |
World Total |
3 019 |
3 311 |
2 969 |
3 438 |
3 877 |
3 912 |
3 660 |
3 769 |
3 944 |
3 780 |
| |
|
|
|
|
|
|
|
|
|
|
|
|
Medicinal plants1/ |
World Total |
1 056 |
1 226 |
1 127 |
1 352 |
1 513 |
1 402 |
1 318 |
1 216 |
1 078 |
1 077 |
Source: FAOSTAT and FAO estimates
Note: Data excludes Intra-EC trade
1/ Includes Intra-EC trade - Separate data for developing and developed countries is not available for cut flowers and medicinal plants
Table 2.4, illustrates the ten year trend in export values for a range of processed[7] NTAEs. The prepared fruit category[8] is by far the most important, with total trade reaching US$2.9 billion in 2001. The prepared vegetable category is next in importance, with trade reaching US$1.6 billion by 2001. For this sub-set of processed commodities, the value of export trade rose from US$6.4 billion to US$8.1 billion between 1992 and 2001.
Not all processed products have seen a rise in export values over this period. The value of trade has fallen, or at best increased only slightly, in some category groups. A decline in the value of trade in concentrated pineapple juice has been offset to a small extent by a rise in the value of trade in its single strength equivalent. Canned products (mushrooms and pineapples in this instance) and the dried goods (tropical fruits, mushrooms) have been steadily declining in importance in world trade. Table A1.6 presents volume data in an equivalent format.
Table 2.4: World exports of selected processed and partially transformed NTAEs by value, 1992-2001
| |
1992 |
1993 |
1994 |
1995 |
1996 |
1997 |
1998 |
1999 |
2000 |
2001 |
|
million US$ |
||||||||||
|
Fruit, prepared1/ |
2 206 |
2 121 |
2 436 |
2 662 |
2 799 |
2 809 |
2 859 |
2 818 |
2 838 |
2 863 |
|
Vegetables, prepared1/ |
1 072 |
1 182 |
1 391 |
1 502 |
1 514 |
1 481 |
1 636 |
1 676 |
1 651 |
1 649 |
|
Tomato Paste |
539 |
561 |
595 |
739 |
749 |
797 |
816 |
781 |
701 |
724 |
|
Apple juice conc. |
453 |
360 |
397 |
567 |
584 |
487 |
336 |
398 |
463 |
503 |
|
Pineapples, canned |
645 |
571 |
537 |
521 |
623 |
470 |
440 |
615 |
469 |
459 |
|
Apple juice |
165 |
153 |
187 |
243 |
313 |
295 |
271 |
279 |
381 |
374 |
|
Mushrooms, canned |
369 |
318 |
400 |
481 |
378 |
291 |
271 |
310 |
370 |
359 |
|
Sweet Corn, processed |
163 |
176 |
198 |
217 |
262 |
288 |
285 |
268 |
272 |
269 |
|
Mushrooms, dried |
267 |
240 |
382 |
485 |
284 |
289 |
255 |
244 |
260 |
234 |
|
Fruit dried1/ |
153 |
153 |
187 |
201 |
246 |
270 |
189 |
194 |
271 |
232 |
|
Tomatoes, peeled |
147 |
180 |
188 |
206 |
213 |
204 |
208 |
230 |
193 |
185 |
|
Pineapple juice |
132 |
98 |
127 |
155 |
181 |
140 |
141 |
174 |
161 |
155 |
|
Tomato juice |
13 |
14 |
27 |
52 |
46 |
50 |
48 |
24 |
24 |
20 |
|
Pineapple juice conc. |
31 |
29 |
33 |
45 |
59 |
49 |
43 |
50 |
16 |
17 |
|
Mango Pulp |
29 |
24 |
33 |
33 |
7 |
6 |
5 |
6 |
6 |
6 |
|
Tropical fruit, dried1/ |
6 |
8 |
8 |
6 |
8 |
29 |
3 |
12 |
7 |
6 |
|
Mango juice |
6 |
6 |
5 |
7 |
10 |
10 |
7 |
9 |
5 |
3 |
|
Tomato juice conc. |
0 |
0 |
0 |
0 |
0 |
0 |
0 |
1 |
1 |
1 |
|
Total selected processed and partially transformed NTAEs |
6 390 |
6 189 |
7 126 |
8 116 |
8 257 |
7 955 |
7 806 |
8 076 |
8 083 |
8 056 |
|
of which: |
|
|
|
|
|
|
|
|
|
|
|
Developing |
3 241 |
3 072 |
3 498 |
4 173 |
4 258 |
3 947 |
3 683 |
4 206 |
3 980 |
4 014 |
|
Developed |
3 149 |
3 117 |
3 628 |
3 943 |
3 998 |
4 008 |
4 123 |
3 870 |
4 103 |
4 042 |
Source: FAOSTAT
Note: Data excludes Intra-EC trade
1/ Not specified elsewhere
Table A1.7 presents a breakdown of world trade in processed and partially transformed products by developed and developing countries. The picture is mixed for developing countries' participation in this trade during the past 10 years. Although the value of developing countries' trade in concentrated apple juice has fallen over the period, they would appear to have captured the lion's share of the growth in trade in single strength apple-juice, overtaking developed country origins as the major suppliers. Developing countries have also captured the larger share of the increased trade in prepared fruits and a somewhat lesser share of the increased trade in prepared vegetables. They have also taken the major share of growth in the value of world tomato paste sales. On the downside, developing countries have shared only marginally in the growth in the value of the processed sweet corn trade, whilst the value of developing countries' trade in peeled tomatoes has declined despite the overall value of world trade having increased.
Further discussion of the role of developing countries in world trade in NTAEs is contained in Section 2.3 which follows.
|
[6] Trade data for cut flowers
includes intra-EU trade which has the effect of inflating the overall figures;
therefore, the focus should be on the trend in the value of trade rather
than in the absolute value of trade. [7] The term "processed" is used in this context to cover activities such as juice making, vegetable canning or drying, tomato paste manufacture etc. [8] This includes all prepared fruit products not specified elsewhere. |
![]()
![]()
![]()