![]()
![]()
![]()
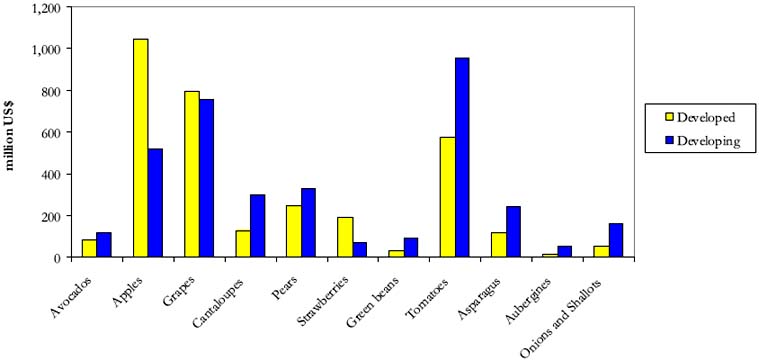
Figures 2.7, 2.8 and 2.9 illustrate the shares held in world trade by leading developing country exporters of fruits and vegetables, based on average export values between 1997 and 2001. Figures 2.8a and 2.9a provide summarize the extent of exporter concentration in world fruit and vegetable trade. More detailed data are available in Annexes A1.8 and A1.9.
Figure 2.7: Developed countries vs developing countries:
exports of selected fruit and
vegetables by value, average
1997-2001
In the case of fruits, it is apparent that the export market for each of the key fruits is dominated by just a handful of suppliers and between them they may account for more than 50 percent of exports by value (Figure 2.8). For example, Chile and Mexico account for 53 percent of world trade in avocados; Mexico, the Philippines and Brazil for 62 percent of world mango trade; Costa Rica and Côte d'Ivoire for 61 percent of trade in pineapples; Thailand and the Hong Kong Special Administrative Region of China for 50 percent of trade in the other fresh fruit category.
Figure 2.8: Leading developing country exporters of
fruits by value,
average share 1997–2001 (%)
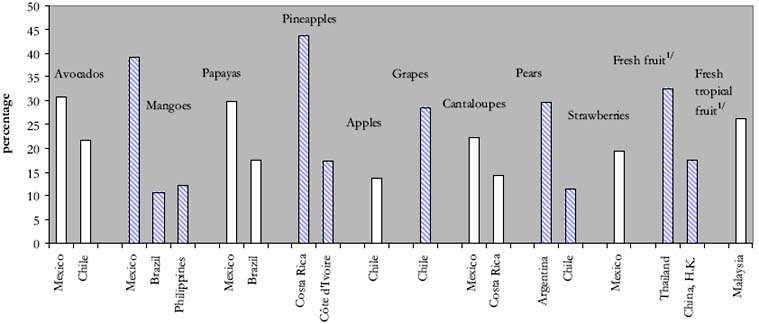
1/ Not specified elsewhere
The exporter base is also highly concentrated, both among individual countries and, in particular, regions. Mexico, for example, is the leading developing country exporter of avocados, mangoes, papayas and strawberries. Brazil is a leading exporter of mangoes and papayas; Costa Rica of pineapples and melons; Chile of grapes, strawberries and avocados. Argentina, Thailand and Malaysia are the leading exporters of pears, fresh fruit and tropical fresh fruit.[9]
There is also a strong regional concentration. The very large, dominant suppliers of non-traditional (temperate and tropical) fruits are either from Latin America or from Asia. Only three African countries, hold more than a 3 percent market share in any product: Côte d'Ivoire and Ghana, with a 17 percent and 3.8 percent share, respectively, in the world pineapple trade; and Kenya, with a 6 percent, share in trade in other tropical fruits. In contrast, in Latin America, there are a number of smaller-scale, second-tier, exporters which account for more than 3 percent of world trade, including the Dominican Republic (avocados), Peru (mangoes), Belize (papayas), Honduras (pineapples), Panama (melons), Colombia (other fresh fruit).
A summary of this exporter concentration is presented in Figure 2.8a. Between 1997 and 2001, 43 percent of total developing country fruit exports by value were shipped by just four (Tier 1) suppliers: Mexico, Chile, Ecuador and Costa Rica. During this period, a further 19 percent of fruits by value were exported by the second tier of suppliers, Colombia, Argentina, Philippines and Turkey. Tier 3 suppliers, comprising the rest of exporters, supplied 38 percent.
Figure 2.8a: Leading developing countries share of fruits
exports by value,
average 1997–2001 (%)

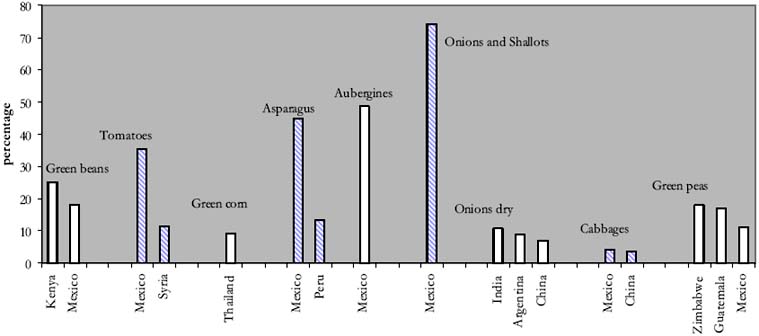
Export trade in vegetables is similarly concentrated (Figure 2.9). Mexico is a leading supplier of tomatoes, asparagus, aubergines and onions. Together, Zimbabwe and Guatemala dominate the world market for green peas, whilst Kenya supplies 25 percent of world trade in green beans. Thailand, India and Mexico are the leading developing country suppliers of green corn, dried onions and cabbages, but none hold shares in these respective export markets exceeding 11 percent. Beyond this handful of countries, there are relatively few developing countries that hold shares of more than 3 percent in exports of any particular product and most of these are either in North Africa (Morocco) or in the Near East, including the Syrian Arab Republic, Jordan and Turkey.
Figure 2.9: Leading developing country exporters of
vegetables by value,
average share 1997–2001 (%)
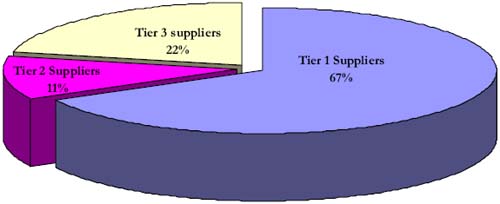
A summary of this concentration among developing country exporters of vegetables is presented in Figure 2.9a. The concentration in the vegetable trade is even more pronounced than it is for the fruit trade. Four Tier 1 suppliers - Mexico, China, Argentina and the Syrian Arab Republic - accounted for 67 percent of developing country vegetable exports by value between 1997 and 2001. Mexico alone, with its proximity to the huge United States market, accounted for a massive two-thirds of the group's exports. The Tier 2 suppliers, in this case Turkey, Morocco, India and Jordan, contributed just 11 percent. Tier 3 suppliers, comprising the rest of exporters, supplied 22 percent.
Figure 2.9a: Leading developing countries share of
vegetables exports
by value, average 1997–2001 (%)
A comparison of leading developing country exporters of fruits and vegetables, by volume share is presented in Annexes A1.10 and A1.11.
Figure 2.10 provides a comparison of the export value shares held by leading developing country exporters in trade in speciality NTAEs such as chillies, ginger, garlic and cut flowers. Again the concentration is marked. Mexico accounts for 43 percent of world trade in chillies, China for 45 percent, 33 percent and 21 percent of world trade in ginger, garlic and medicinal herbs, respectively, and Colombia for 14 percent of world trade in cut flowers. If one assumes that a significant percentage of the exports from the Hong Kong Special Administrative Region of China will have originated in mainland China, then China's overall share in world trade in garlic and medicinal herbs may be as high as 40 percent and 35 percent, respectively.
Figure 2.10: Leading developing country exporters of
speciality NTAEs by value,
average share 1997–2001
(%)
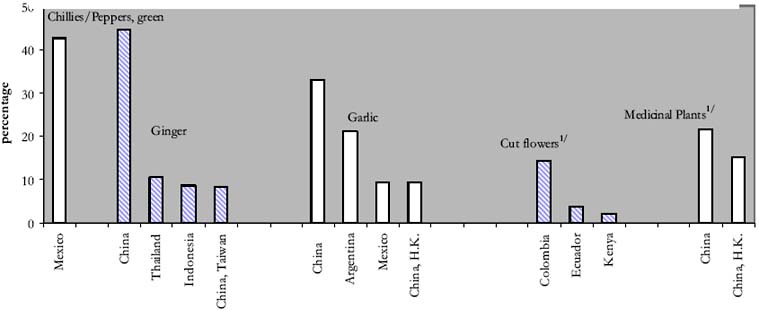
1/ Average share 1996-2000 (percent)
The share of developing country exporters in the processed products categories (Figure 2.11) varies markedly depending on the product. For example, China accounts for 52 percent of world trade in both dried mushrooms and canned mushrooms. The canned pineapple trade is dominated by Thailand with a 45 percent share of world trade in value terms. Chile and Argentina account for one quarter of world trade in concentrated apple juice; Turkey, Chile and China for 35 percent of world trade in tomato paste. China's growth in apple juice exports has been rapid and disruptive of traditional markets, resulting in dumping actions in the US and import restraints in the EU. China is also a rapidly rising exporter of tomato paste, and now features among the top three exporters.
Figure 2.11: Leading developing country exporters of processed/partially transformed NTAEs by value, average share 1997–2001 (%)
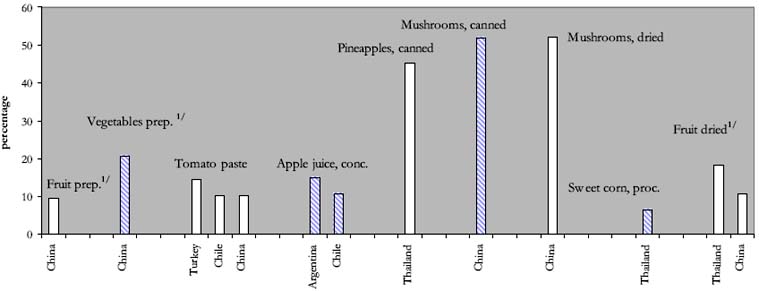
1/ Not specified elsewhere
The share of developing countries in the prepared vegetables and prepared fruit categories is not as high as in the other categories, but far from insignificant. China, Thailand and Peru account for one third of world trade in prepared vegetables; China Thailand and Chile for 20 percent of world trade in prepared fruits. At the regional level, Latin American and, particularly, Far Eastern countries dominate the trade. Sub Saharan Africa is very poorly represented. Only Kenya, with an 8 percent share in the canned pineapple trade, is significant. A more detailed breakdown of this data is presented in Annex tables A1.12 and A1.13.
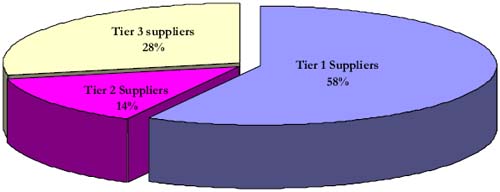
A summary of the leading developing country exporters of the selected processed/partially transformed NTAEs is presented in Figure 2.11a. Of the four Tier 1 suppliers which feature prominently in the trade of processed products (China, Thailand, Chile and Turkey), China is by far the most important, accounting for over half of the 58 percent share of developing country exports held by this group. The Tier 2 suppliers, in this case Philippines, Mexico, Argentina and Indonesia, accounted for 14 percent of developing country exports by value over this period, with 28 percent accounted for by all other developing countries.
Figure 2.11a: Leading developing countries share of
processed/partially
transformed NTAEs exports by value, average
1997–2001 (%)
LDCs' exports of NTAEs in the fruit and vegetable categories can be measured in thousands of dollars and hundreds of metric tonnes.
The only LDC exporting country of any significance is Niger, which accounts for 2.6 percent of world green bean exports by value. Between them, Burkina Faso, Haiti, Yemen, Uganda, Madagascar and the Lao People's Democratic Republic export mangoes and papayas and fruits in the "other" category, but these exports are typically small-scale with considerable variability in the volumes shipped year-on-year.[10] In the vegetable category, the United Republic of Tanzania is developing its export market for green peas. Niger, and to a lesser extent Ethiopia and Madagascar, are developing a more consistent export presence in the market for dried onions; whilst Ethiopia and Yemen feature more frequently as exporters of tomatoes.
The overall value of world trade in fruit and vegetables by LDCs remains small. In the five year period between 1997 and 2001, LDC trade in fruits averaged around US$62 million and trade in vegetables averaged US$46 million.
In volume terms, LDCs' share of total world trade in fruit and vegetables during this period was 0.5 percent and 0.8 percent, respectively (Tables 2.5 and 2.6).
Table 2.5: Average share of LDCs in total world trade of fruits, 1997-2001
|
|
|
1997 |
1998 |
1999 |
2000 |
2001 |
Share in world exports |
|
'000 tonnes |
percent |
||||||
|
Avocados |
LDC |
0.0 |
0.0 |
0.1 |
0.0 |
0.0 |
0.0 |
|
World |
164.6 |
236.2 |
211.7 |
281.0 |
248.7 |
|
|
|
Mangoes |
LDC |
19.8 |
11.6 |
13.8 |
23.7 |
19.1 |
3.4 |
|
World |
438.7 |
501.4 |
506.4 |
561.5 |
590.2 |
|
|
|
Papayas |
LDC |
0.0 |
0.0 |
0.2 |
0.2 |
0.1 |
0.1 |
|
World |
112.8 |
129.3 |
152.0 |
172.6 |
192.3 |
|
|
|
Pineapples |
LDC |
0.8 |
1.0 |
0.4 |
2.6 |
1.9 |
0.2 |
|
World |
746.2 |
721.3 |
838.0 |
848.4 |
953.4 |
|
|
|
Apples |
LDC |
9.7 |
6.6 |
9.2 |
9.7 |
4.9 |
0.2 |
|
World |
3 567.1 |
3 347.1 |
3 357.1 |
3 478.0 |
3 654.6 |
|
|
|
Grapes |
LDC |
101.6 |
22.3 |
35.7 |
37.5 |
41.7 |
2.7 |
|
World |
1 606.0 |
1 507.4 |
1 668.4 |
2 011.9 |
1 892.4 |
|
|
|
Cantaloupes and other melons |
LDC |
0.0 |
1.0 |
0.9 |
2.1 |
1.2 |
0.1 |
|
World |
985.1 |
1 214.0 |
1 189.2 |
1 118.2 |
1 009.1 |
|
|
|
Pears |
LDC |
0.0 |
0.0 |
0.1 |
0.4 |
0.4 |
0.0 |
|
World |
1 101.1 |
1 028.9 |
1 034.9 |
1 054.4 |
1 119.6 |
|
|
|
Strawberries |
LDC |
0.0 |
0.0 |
0.0 |
0.0 |
0.0 |
0.0 |
|
World |
127.1 |
156.4 |
187.2 |
167.9 |
208.6 |
|
|
|
Fresh fruit1/ |
LDC |
7.8 |
2.4 |
9.0 |
12.2 |
9.0 |
1.4 |
|
World |
512.7 |
401.6 |
550.3 |
622.2 |
715.8 |
|
|
|
Fresh tropical fruit1/ |
LDC |
4.4 |
3.5 |
5.2 |
4.9 |
11.8 |
4.8 |
|
World |
107.7 |
101.7 |
123.6 |
146.3 |
142.9 |
|
|
|
Other2/ |
LDC |
4.5 |
8.5 |
13.0 |
12.5 |
11.1 |
0.4 |
|
World |
2 039.6 |
1 987.7 |
2 259.3 |
2 687.3 |
2 734.2 |
|
|
|
Other3/ |
LDC |
49.6 |
45.5 |
56.7 |
49.2 |
57.9 |
0.3 |
|
World |
19 243.5 |
18 927.4 |
18 567.1 |
19 187.1 |
19 642.3 |
|
|
|
Total |
LDC |
198.3 |
102.4 |
144.2 |
154.9 |
159.1 |
0.5 |
|
World |
30 752.2 |
30 260.6 |
30 645.3 |
32 336.8 |
33 104.0 |
|
|
Source: FAOSTAT
Notes: Data excludes Intra-EC trade
1/ Not specified elsewhere
2/ List of other fruits includes: inter alia, stone fruit (apricots, peaches, etc.), berries (raspberries, blueberries, etc.), cashewapple, kiwi fruit, figs and dates
3/ Includes bananas and citrus fruit (oranges, grapefruits, lemons, etc.)
Table 2.6: Average share of LDCs in total world trade of vegetables, 1997-2001
| |
|
1997 |
1998 |
1999 |
2000 |
2001 |
Share in world exports |
|
|
|
'000 tonnes |
percent |
||||
|
Asparagus |
LDC |
0.0 |
0.0 |
0.0 |
0.0 |
0.0 |
0.0 |
|
World |
96.6 |
105.2 |
126.3 |
139.5 |
138.5 |
|
|
|
Green beans |
LDC |
11.8 |
19.1 |
19.0 |
26.7 |
11.7 |
12.3 |
|
World |
120.4 |
147.2 |
135.6 |
161.7 |
152.3 |
|
|
|
Cabbages |
LDC |
0.4 |
0.4 |
0.4 |
0.4 |
0.7 |
0.0 |
|
World |
642.7 |
663.9 |
741.5 |
676.6 |
748.4 |
|
|
|
Aubergines |
LDC |
0.0 |
0.0 |
0.0 |
0.0 |
0.0 |
0.0 |
|
World |
106.4 |
134.5 |
134.3 |
156.8 |
149.2 |
|
|
|
Green corn |
LDC |
0.0 |
0.0 |
0.0 |
0.0 |
0.0 |
0.0 |
|
World |
113.3 |
50.9 |
51.1 |
55.8 |
62.1 |
|
|
|
Onions dry |
LDC |
44.1 |
60.7 |
76.7 |
62.6 |
54.6 |
2.4 |
|
World |
2 276.0 |
2 551.3 |
2 712.1 |
2 480.8 |
2 603.7 |
|
|
|
Onions and Shallots |
LDC |
1.5 |
0.1 |
0.0 |
0.3 |
0.3 |
0.1 |
|
World |
407.9 |
484.2 |
489.8 |
487.9 |
450.8 |
|
|
|
Green peas |
LDC |
0.6 |
3.7 |
3.1 |
0.8 |
2.3 |
3.0 |
|
World |
68.5 |
82.6 |
69.4 |
67.9 |
61.4 |
|
|
|
Tomatoes |
LDC |
0.7 |
2.7 |
5.5 |
3.8 |
5.8 |
0.2 |
|
World |
2 110.3 |
2 435.5 |
2 248.5 |
2 191.8 |
2 389.3 |
|
|
|
Other1/ |
LDC |
14.2 |
25.1 |
22.5 |
29.4 |
34.7 |
0.4 |
|
World |
5 684.5 |
6 205.2 |
6 545.0 |
6 670.4 |
7 185.8 |
|
|
|
Total |
LDC |
73.3 |
111.8 |
127.3 |
124.1 |
110.1 |
0.8 |
|
World |
11 626.5 |
12 860.4 |
13 253.6 |
13 089.2 |
13 941.5 |
|
|
Source: FAOSTAT
Notes: Data excludes Intra-EC trade
1/ List of other vegetables includes: inter alia artichokes, lettuce, spinach, cauliflower, pumpkins, squash, gourds, cucumbers, gherkins, leeks, broad beans, string beans, carrots, okra and mushrooms
|
[9] Fresh fruit and tropical
fruits not specified elsewhere. [10] This may be as a result of under-recording or misrecording, or it may also be an indication of the much more opportunist nature of exports, particularly where these are intra-regional. |
![]()
![]()
![]()