![]()
![]()
![]()
Ana Cláudia de Carvalho Badan[27]
Elcio Perpétuo Guimarães[28]
Catalina Ramis[29]

Ana Cláudia de Carvalho Badan
Abstract
Pyricularia grisea Sacc. causes blast, the most important fungal disease of cultivated rice. One way to control the losses it causes is to use resistant cultivars. In 1995, Embrapa Arroz e Feijão (Goiânia, Brazil) created CNA-7, a population with a broad genetic base and carrying various sources of resistance to blast. Through several cycles of selection and recombination, plants with complete resistance to both leaf (Bl) and neck blast (NBl) were developed. This chapter evaluates progress made through population improvement. S0:2 families resistant to both blast types were selected for experiments. Results suggest that resistance percentage (%R) seems to be the most efficient trait for this type of analysis. Resistance to Bl in population CNA-7 increased by 13.1% in cycle 1 and 6.1% in cycle 2, indicating that the strategy adopted was efficient for improving resistance to Bl. In contrast, no statistical differences were found among treatments for resistance to NBl, indicating that no genetic gain was obtained. The statistical significance observed for planting date indicates the importance of considering this parameter in evaluations. The high degree of resistance observed since the initial cycle suggests that the selection of parents to create the original population was highly adequate. The high level of resistance present in population CNA-7 in the recurrent selection cycles means selection for other traits can begin, or that new sources of germplasm for crosses can be extracted.
Resumen
Pyricularia grisea Sacc. causa la más importante enfermedad fúngica del cultivo del arroz. Una manera de controlar las pérdidas que provoca es el uso de cultivares resistentes. En 1995, Embrapa Arroz e Feijão (Goiânia, Brasil) creó la población CNA-7 de amplia base genética y con varias fuentes de resistencia a la enfermedad. A través de varios ciclos de selección y recombinación, plantas con resistencia completa tanto a Piricularia en la hoja (Bl) y en el cuello de la panícula (NBl) fueron desarrolladas. Este capítulo evalúa el progreso realizado a través del mejoramiento poblacional. Familias S0:2 resistentes para ambas características fueron seleccionadas en los experimentos. Los resultados de la característica porcentaje de Resistentes (%R) parecieron ser los más eficientes para ese tipo de análisis. Resistencia a Bl en la población CNA-7 se incremento 13.1% en el ciclo 1 y 6.1% en el ciclo 2, lo cual indica que la estrategia de selección adoptada fue eficiente para mejorar Bl. En contraste, ninguna diferencia estadística fue encontrada entre tratamientos para resistencia a NBl, lo que indica que ninguna ganancia genética fue obtenida. La significación estadística observada para data de siembra indica la importancia de considerar ese parámetro en las evaluaciones. El alto grado de resistencia observado desde el inicio de los ciclos sugiere que la selección de genitores para creación de la población original fue altamente adecuada. El alto nivel de resistencia presente en la población CNA-7 en los ciclos de selección recurrente significan que selección para otras características puede ser iniciada, o que nuevas fuentes de germoplasma para cruzamientos pueden ser extraídas.
Blast, caused by the fungus Pyricularia grisea Sacc., the anamorph of Magnaporthe grisea (Herbert) Barr, is responsible for losses in rice productivity that can vary from 17% to 52% (Prabhu et al., 1999). This disease affects rice crops in almost all Latin American countries, being more severe under upland conditions. The creation of resistant varieties is a strategy that has been heavily used by researchers to control this problem. Even so, the pathogen’s great variability has frequently succeeded in breaking, within a short period, the resistance of released varieties (Correa-Victoria et al., 1997), which, according to Notteghen (1981), usually lasts only 2 or 3 years.
As an additional alternative to the strategies used to improve autogamous species, population improvement began being used for rice at the end of the 1980s. The first studies to focus on population improvement for resistance to blast were carried out by Guimarães et al. (1995), and Filippi and Prabhu (1997). These studies describe the results of and experiences with the use of the methodology to develop populations with complete or partial resistance to the disease. With similar objectives, Courtois et al. (1997) indicated that the International Rice Research Institute (IRRI, Philippines) will use this strategy to create and improve populations of upland rice with resistance to the disease.
In Colombia, Guimarães and Correa-Victoria (1997) improved resistance to leaf and neck blasts in population GC-91 through recurrent selection, which was based on evaluating S0:2 families. They proved that the methodology functions for traits controlled by series of major and minor genes.
Embrapa Arroz e Feijão (Brazil) has been using this methodology to improve the level of resistance of populations to blast for some years. This work is based on population CNA-7, which was developed by Filippi and Prabhu (1997). Its composition has been described by Châtel and Guimarães (1998).
Recurrent selection is characterized by being a cyclical method in which gains for the trait or traits under selection occur gradually and continuously. Although this supposes that the methodology of evaluation and selection is sufficiently precise to permit the procedural steps to be efficiently completed, situations can occur in which the evaluation or decisions for selection do not lead to the expected results. Hence, plant breeders using this methodology are recommended that, after a given number of recurrent cycles, they evaluate the gains obtained for the trait or traits under selection.
One possible way of evaluating the efficiency of selection across recurrent selection cycles is to take advantage of the same steps of managing the populations, and to organize them so that comparison across different cycles in different years is viable. This has become acceptable for use with common checks across the years, so that the means are adjusted in relation to the planting years. This type of study follows the same principle used to compare different varieties released by national breeding programmes over several years (Vencovsky et al., 1986; Breseghello et al., 1999; Santos et al., 1999; Soares et al., 1999).
Another way of evaluating gains obtained throughout the programme is to compare different cycles within a single experiment, as did Ceballos et al. (1991), Gatica (1993), Bauske et al. (1994), Salter et al. (1994), Laurentin (1996), and Díaz-Lago et al. (2002). Thus, the effect of interaction between years can be guaranteed as eliminated and a more effective comparison between treatments is achieved.
With this second methodology, experiments normally use the statistical randomized complete block design, with several replications and across several sites. Almost always, the traits evaluated are those for which selections were done, although others are sometimes also evaluated. This would ultimately indicate the influence that the selection for one trait has had over another, that is, the correlated response (see I.O. Geraldi, Chapter 3, this volume). An example of this occurred with a population of oats where selection for resistance to the fungus Puccinia also altered flowering (Díaz-Lago et al., 2002).
Some studies use recurrent selection to increase grain productivity through increasing resistance to diseases, subjecting populations to high inoculum pressure during selection. To verify if the strategy used had been efficient, Gatica (1993) compared the different recurrent cycles of a population of maize. Interestingly, in this case, grain productivity increased across the cycles in only one of the two sites evaluated - precisely the site where the selections had been performed. This strongly indicates a significant genotype-by-environment interaction. In sesame, Laurentin (1996) verified an increase in the population’s grain productivity between cycles 0, 1 and 2 (C0, C1 and C2, respectively), and under conditions of increasing resistance to whitefly (Bemisia sp.). This was more readily observed after confirming that no increase occurred in traits correlating with yield, such as grain weight or number of grains per pod.
In the study on oats, evaluations of genetic gain indicated that there was efficiency in selection for resistance to the fungus Puccinia coronata, using recurrent selection (Díaz-Lago et al., 2002). However, the lack of homogeneity of variance across experiments located at different sites required a series of detailed statistical analyses, thus demonstrating that the evaluation of levels of incidence of disease in the field is not simple. These analyses involved the transformations suggested by Box and Cox (Díaz-Lago et al., 2002) and Azzalini-Cox (Díaz-Lago et al., 2002), and using the program ‘Proc Mixed’ of SAS, all statistical procedures that are currently not normally used in agriculture.
To analyse data on diseases, Amézquita et al. (1996) used another alternative to demonstrate the progress of resistance to blast in a rice population: categorical data, using two models. The first model took ‘reaction to blast’ as a binary variable (Resistant £ 3 and Susceptible ³ 4). The second model took it as a categorical variable with three levels (Resistant £ 3; Intermediate = 4 or 5; and Susceptible ³ 6). For both models, the differences detected between treatments were statistically significant, that is, the selection process used was efficient for increasing resistance in the population.
Ceballos (n.d.), in his book on plant improvement, cited several examples where recurrent selection was efficient in increasing resistance. The analysis of several of these studies is noteworthy in that the evaluations of resistance were carried out on the basis of both the means of levels of incidence of disease or the percentage of infected plants. Apparently, no general norm exists for indicating the types of data to use or what types of analyses are more efficient for demonstrating genetic progress in studies seeking to increase resistance.
Another factor worth pointing out is that, in the cited works, the strategy for evaluating the programme is based on comparing composites of cycles, that is, comparing C0 with C1, and C1 with C2, and so on. However, Laurentin (1996) also evaluated the parents of each cycle, and the composites of the cycles with their checks. The interesting aspect of this strategy is that the results of comparing the parents of the cycles had a positive response, that is, genetic gain occurred, but the level of probability was below what was expected (P = 0.06). In contrast, the comparison of cycles with the checks (planted in the same year) presented results that accorded with the analysis of the composites.
Our study evaluates the procedure - population improvement through recurrent selection - used to increase the level of resistance in the upland rice population CNA-7 to leaf blast (Bl) and neck blast (NBl). It concerns an innovative strategy for recurrent selection in rice that involves the concepts of selecting for the two traits alternately under high inoculum pressure. To determine if the strategy used was efficient, we present the results of the study in which genetic gains were evaluated across two recurrent cycles.
We started with the principle that population improvement through recurrent selection permits the accumulation of favourable genes and, at the same time, also permits a systematic mixture of traits from parental materials. We then proposed to create a population with a broad genetic base, using 20 parental materials that were resistant to blast.
The creation and management of the upland rice population CNA-7 was carried out at the Capivara Experiment Station (CES) of Embrapa Arroz e Feijão, Santo Antônio de Goiás, Brazil. Populations with the male-sterility gene, CNAIRAT 5/2/1 (also known as CNA-7A) and CNA-IRAT 9B/2/2 (or CNA-7B), which were being managed by Filippi and Prabhu (1997), formed the bases for creating CNA-7, the population used in this work. This population originates from the mixture, in equal proportions, of seeds from CNA-7A and CNA-7B. In 1994, 20 sources of resistance to blast were introduced, together with the source for grain quality, the U.S. variety Lemont. The contribution of each component to the new population is presented in Table 1.
Table 1. List of parental materials introduced into rice populations CNA-IRAT 5/2/1 and CNA-IRAT 9B/2/2 to form populations CNA-7A and CNA-7B, respectively. Their relative contributions as sources of resistance to blast are given as percentages.
| Parent | Origin | CNA population | |
| 7A | 7B | ||
| Carreon | T | 1.68 | 2.50 |
| Dular | T | 1.68 | 2.50 |
| Três Marias | T | 1.68 | 2.50 |
| Huan-Sen-Goo | T | 1.68 | 2.50 |
| Colombia 1 | T | 1.68 | 2.50 |
| IRI 342 | T | 1.68 | 2.50 |
| IRI 344 | T | 1.68 | 2.50 |
| IRI 355 | T | 1.68 | 2.50 |
| Araguaia | IAC 47/TOX 2578/7-4-2-3-B2 | 1.68 | 2.50 |
| Lemonta | Lebonnet/PI331581/CI9881 | 5.05 | |
| No. 48 Formoso 92 | Ram Tulase/3*IAC 25 | 1.68 | 2.50 |
| No. 55 Formoso 92 | T-23/3*IRAT 112 | 1.68 | 2.50 |
| No. 09 Formoso 92 | Pusur/3*IAC 25 | 1.68 | 2.50 |
| No. 36 Formoso 92 | CTG 1516/3*IRAT 112 | 1.68 | 2.50 |
| No. 34 Formoso 92 | Tetep/3*IRAT 112 | 1.68 | 2.50 |
| No. 54 Formoso 92 | C46-15/3*IAC 25 | 1.68 | 2.50 |
| No. 40 91/92b | Cuiabana/CNAx 784-5 | 1.68 | 2.50 |
| No. 108 91/92b | A8-204-1/TOm 1-3 | 1.68 | 2.50 |
| No. 70 91/92b | CNA-5180/Basmati 370 | 1.68 | 2.50 |
| No. 60 91/92b | CNA-5180/Toride | 1.68 | 2.50 |
| CNA-IRAT 9B/2/2 CNA-IRAT | CNA-IRAT 5 CNA-IRAT 5 | 61.35 | 50.0 |
a. Added as a source for grain quality.
b. Polycytoplasmic material.
The recurrent selection method used to improve population CNA-7 is summarized in Table 2, and the evaluation strategy used to carry out selections during the cycles is described later. We point out that, in the cropping season 1998/99, the first improved population was created, that is, the first recurrent selection cycle was completed. By the 2000/01 season, the second recurrent cycle was achieved.
Table 2. Summary of the flow of materials of the upland-rice population CNA-7 at the Capivara Experiment Station (CES), Santo Antônio de Goiás, and at the Tocantins Advanced Field for Development and Research (TAFDR), Brazil. The population improvement method was used, evaluating S0:2 families for resistance to leaf blast (Bl) and neck blast (NBI).
| Year | Site | Activity | Management | Stage |
| 1994/95 | CES | Create CNA-7 (mixture of seeds from CNA-7A and CNA-7B) | | Evaluation and selection (154 S0 plants) |
| 1995/96 | CES | Plant 154 S0 plants | Harvest male-sterile plants | Recombination |
| 1996/97 | CES | Plant S0 (cycle 0) in two different seasons | | Evaluation and selection (48 plants resistant to NBl and 51 plants resistant to Bl) |
| 1997 | TAFDR | Plant 94 S0:1 families | Advance generation | |
| 1997/98 | CES | Plant 94 S0:2 families in two different seasons | | Evaluation and selection (54 families) |
| 1998 | TAFDR | Plant seed mixture from 54 S0:1 families (remnant seeds stored in cold room) and plant seeds selected from S0:2. Transplant 2215 plants, of which 314 (14.2%) were male-sterile | Harvest male-sterile plants | Recombination |
| 1998/99 | CES | Plant 3000 S0 plants (cycle 1) in two different seasons | | |
| 1999 | TAFDR | Bl Plant 118 S0:1families | Advance generation | Evaluation and selection Harvest of seeds from 5 fertile plants per family |
| 1999/00 | CES | Plant 114 S0:2 families | | Evaluation and selection (27 families) |
| 2000 | TAFDR | Plant seed mixture from 27 S0:1families (remnant seeds stored in cold room)) and plant seeds selected from S0:2. Conduct cycle 2. Plant 500 S0 plants from the 3 cycles for recombination | Harvest male-sterile plants | Recombination |
| 2000/01 | CES PESa | Plant the 3 cycles, using the experimental design of randomized complete blocks at two sites (1000 plants per season) | Study genetic gain | |
a. Palmital Experiment Station
The study presented and discussed in this chapter was conducted in the 2000/01 cropping season, using as material the original population (C0) and the two improved populations (C1 and C2).
Strategy for evaluation and selection
The environment in which the materials are evaluated and selected is vitally important to the success of the improvement strategy. The CES, which possesses soils classified as ‘red-yellow dystrophic Latosols’, has an environment that is considered to be similar to the rest of Brazil’s central region in terms of disease pressure and races of the blast pathogen. As efforts are being made to develop new materials for this area, work is being conducted in the targeted environment and, consequently, results obtained can be immediately transferred to other sites in the area.
Materials were evaluated by using the scales proposed by IRRI (1988) but, before discussing this aspect, we should mention some basic concepts of the disease, and its cycle and epidemiology. In the tropics, the fungus Pyricularia grisea can be found in the air throughout the year (Frohlich and Rodewald, 1970), but only under certain conditions of humidity, light, and temperature fluctuation does the disease develop (Yap, 2000).
The conidium, deposited on the surface of a plant, develops a germination tube that ends in an appressorium that will allow it to penetrate the host through the cuticle (Leung and Shi, 1994). The fungus can infect leaves or panicle necks of rice plants. Usually, in the field, plants have either affected leaves, or affected panicles or panicle necks. Bonmann et al. (1989) suggested that the races of the fungus attacking leaves are the same as those that attack panicle necks, although the plant’s mechanisms for resistance to the two diseases (leaf blast and neck blast) may be different.
Results from fieldwork at CES indicate that, in February, Bl pressure is heavier, whereas, in March, NBl pressure predominates. Taking this into account, we attempted to synchronize the plant’s phenological stages with high disease incidence. This procedure ensured that the period of greatest disease incidence coincided with the plants’ developmental stages when tissues of panicle necks and leaves would be most susceptible (Prabhu et al., 1999). Materials were therefore planted in December to evaluate NBl in March, and in January to evaluate Bl in February. The S0 and S0:2 seeds of different recurrent selection cycles of population CNA-7 were divided and sown in these two planting months (December and January). Selection of families was based on both sets of data (Bl and NBl), with intensity of selection varying between years, but remaining about 20%.
The S0:2 families were planted at CES in two 1-m rows at a density of 80 seeds per metre for the NBl evaluation and of 100 seeds per metre for Bl. The distance between rows was 0.35 m. Spreaders were planted perpendicularly to the rows, using a mixture of seeds from the susceptible varieties Rio Paranaíba, Caiapó and IAC 47. After every four rows, one was planted with the check Caiapó and the next with the check Rio Paranaíba, thus permitting analysis of the adjusted means to help in selection.
For Bl evaluation, a scale of 0 to 9 was used, where scores of 0 to 3 indicated resistant plants, 4 and 5 intermediately resistant, and 6 to 9 susceptible (IRRI, 1988). For NBl evaluation, a scale of 0, 1, 3, 5, 7, 9 was used, where 0 and 3 indicated resistance, 5 intermediate resistance, and 7 and 9 susceptibility (IRRI, 1988). Selection was carried out, choosing the families that performed best for the two traits.
Experimental design for evaluating genetic gain
Observed genetic gain (Gs), also called genetic progress, is a parameter used by improvement programmes to evaluate the efficiency of the selection method applied. It is generally used to evaluate the expected gain. Morais et al. (2000), however, suggest that it is also important to evaluate the gains actually obtained, that is, gains observed within an improvement programme, so that the efficiency of the procedures carried out can be critically analysed.
Most studies evaluating genetic gain consider the trait yield, but using other traits is both possible and justifiable (Morais and Rangel, 1997). This study evaluates gain observed for the traits resistance to Bl and resistance to NBl in population CNA-7.
To do this, in December 2000, we established a trial made up of three treatments: C0, C1 and C2, distributed in randomized complete blocks with four replications at two sites: CES and the Palmital Experiment Station (PES, Brazabrantes). The CES was the same site where population CNA-7 had been managed in the selection stages and PES is a farm where irrigated rice is mostly planted.
For each site (CES and PES), two experiments were carried out, with one being planted 10 days after the other. Hence, there were two planting dates.
In each plot, 500 plants were planted, spaced at 0.1 × 0.50 m and distributed in 25 2-m rows. Parallel to these rows and among blocks, were three rows, spaced at 0.7 m intervals, planted with the mixture of the susceptible cultivars Primavera, IAC 47 and Rio Paranaíba, which served as inoculum spreaders. In January 2001, the experiment was repeated.
For the experiments planted in December, NBl was evaluated in March, and for the January ones, Bl was evaluated in February. Both Bl and NBl were evaluated according to the IRRI scales (1988), using 200 plants at random within the plot, as recommended by Badan et al. (1998).
Seeds from the evaluated treatments were multiplied and recombined at CES and the Tocantins Advanced Field for Development and Research (TAFDR), in the semester before the experiments were established (Table 2). For this, the technique used was to plant the seeds in trays at three different periods to guarantee efficient recombination among the materials.
Statistical analysis of genetic gain
Genetic gain was measured first according to the mean value of the levels of incidence of the diseases (Filippi and Prabhu, 1997) and then to the frequency of resistant or intermediately resistant plants (Guimarães and Correa- Victoria, 1997). To calculate the mean of plots, data from the 200 evaluated plants were used.
An analysis of variance (ANOVA) per experiment was carried out, using model I (fixed), for which the ANOVA procedure of the SAS program (SAS Institute, Inc., 2000) was used. The Hartley test (1950) was carried out to determine if the variances of errors at the different sites were homogeneous, and a combination analysis was carried out for cases where responses were positive. Where significant differences occurred among treatments, response to selection was calculated according to the formula modified from García (1995):
Gs = R(Cn) - R(C0)
where:
Gs is gain with total selection
R(Cn) is response of the improved population
R(C0) is response of the original unimproved population
Response to selection in percentage terms (Gs%), as percentage of C0, was calculated, according to the formula:
Gs% = [R(Cn) - R(C0)]/R(C0) × 100
To estimate genetic progress, heritability was estimated according to the calculation of regression of data from the mean of the cycles. This was possible by considering the values of C1 and C2 as percentages of C0 (Falconer, 1968; Gatica, 1993).
Results conformed with the trait evaluated, first with the data for leaf blast Bl) and then with those for neck blast NBl). Table 3 for Bl and Table 4 for NBl show the real values obtained in the experiments (i.e. the mean of 200 plants per experiment). The letters represent the results of Duncan’s statistical tests, differentiating among the values. Tests between treatments, sites, or seasons/sites (experiment) are represented horizontally or vertically, with upper or lower case letters, as described in the footnotes of each table.
Table 3. Data on leaf blast for the average level of incidence of disease, percentage of resistant plants (%R) and percentage of intermediately resistant plants (%I) in treatments cycle 0 (C0), 1 (C1) and 2 (C2) of rice population CNA-7. Data obtained from experiments conducted at the Capivara and Palmital Experiment Stations, Brazil, for two planting dates (CES 1 and 2, and PES 1 and 2).
| Experiment | Averagea | %Rb | %Ib | ||||||||||
| C0c | C1c | C2c | Meane,e | C0c | C1c | C2c | Meand,e | C0d | C1d | C2d | Meand,e | ||
| CES | | | | | | | | | | | | | |
| | 1f | 2.12a | 1.49b | 1.59b | A 1.72 | 0.73b | 0.85a | 0.82a | A 0.80 | 0.26a | 0.15b | 0.18b | A 0.19 |
| 2g | 2.37a | 1.79b | 1.67b | B 1.94 | 0.62b | 0.82a | 0.86a | A 0.77 | 0.37a | 0.17b | 0.14b | A 0.23 | |
| Mean | 2.24a | 1.64b | 1.63b | 1.80A | 0.68b | 0.84a | 0.84a | 0.78A | 0.31a | 0.16b | 0.16b | 0.21A | |
| PES | | | | | | | | | | | | | |
|
| 1f | 2.17a | 2.20a | 1.76b | A 2.04 | 0.65b | 0.68ab | 0.76a | A 0.69 | 0.34a | 0.31a | 0.23a | A 0.29 |
| 2g | 1.88a | 1.56ab | 1.21b | B 1.54 | 0.69b | 0.75b | 0.83a | B 0.76 | 0.29a | 0.24a | 0.16b | B 0.23 | |
| Mean | 2.02a | 1.88a | 1.48b | 1.80A | 0.67b | 0.71b | 0.79a | 0.73B | 0.31a | 0.27a | 0.19b | 0.26B | |
| Overall mean | 2.13a | 1.76b | 1.56c | | 0.67ª | 0.78b | 0.82c | | 0.31a | 0.21b | 0.18c | | |
a. Transformation of data by the root of (x + 0.5) to carry out ANOVA and Duncan’s test.
b. Transformation of data by the arcosine of the root of (x + 0.05) to carry out ANOVA and Duncan’s test.
c. Comparison between treatments (row).
d. Comparison between means of sites (column, capital letters after the values, boldface).
e. Comparison between date/site (column, capital letters in front of the values).
f. First planting date g. Second planting date (10 days after the first)
Table 4. Data on neck blast for the average level of incidence of disease, percentage of resistant plants (%R) and percentage of intermediately resistant plants (%I) in treatments cycle 0 (C0), 1 (C1) and 2 (C2) of rice population CNA-7. Data obtained from experiments conducted at the Capivara and Palmital Experiment Stations, Brazil, for two planting dates (CES 1 and 2, and PES 1 and 2).
| Experiment | Averagea | %Rb | %Ib | ||||||||||
| C0c | C1c | C2c | Meand, e | C0c | C1c | C2c | Meand, e | C0d | C1d | C2d | Meand, e | ||
| CES | | | | | | | | | | | | | |
| | 1f | 0.43b | 0.96a | 0.48b | A 0.62 | 0.92a | 0.88a | 0.93a | A 0.91 | 0.04a | 0.06a | 0.03a | A 0.05 |
| 2g | 0.35a | 0.39a | 0.26a | B 0.33 | 0.96a | 0.95a | 0.97a | A 0.96 | 0.01a | 0.03a | 0.02a | B 0.03 | |
| Mean | 0.39b | 0.68a | 0.37b | 0.48 | 0.94a | 0.92a | 0.95a | 0.94 | 0.03a | 0.04a | 0.03a | 0.04 | |
| PES | | | | | | | | | | | | | |
| | 1f | 1.43a | 1.28a | 0.99a | A 1.23 | 0.84a | 0.85a | 0.89a | A 0.86 | 0.09a | 0.11a | 0.04b | A 0.08 |
| 2g | 1.81a | 1.74a | 1.34a | B 1.63 | 0.78a | 0.80a | 0.85a | B 0.81 | 0.11a | 0.13a | 0.10a | B 0.12 | |
| Mean | 1.62a | 1.51ab | 1.16b | 1.43 | 0.81b | 0.83ab | 0.87a | 0.84 | 0.10ab | 0.12a | 0.08b | 0.10 | |
| Overall mean | 1.04 | 1.07 | 0.85 | | 0.87 | 0.87 | 0.91 | | 0.07 | | 0.09 | 0.05 | |
a. ANOVA with data transformed by the root of (x + 0.5).
b. ANOVA with data transformed by the arcosine of the root of (x + 0.05).
c. Comparison between treatments (row).
d. Comparison between date/site (column, capital letters)
e. We could not carry out comparisons with the data for the means of sites at PES, nor for the overall mean because the criteria for homocedasticity of variance were not fulfilled.
f. First planting date
g. Second planting date (10 days after the first)
Table 5. Mean squares (MS) from the combination analysis of variance and coefficients of variation (CV) for the average level of incidence of disease, percentage of resistant plants (%R) and percentage of intermediately resistant plants (%I) for the trait resistance to leaf blast in rice population CNA-7. Data obtained from the Capivara and Palmital Experiment Stations, Brazil, for two planting dates (CES 1 and 2 and PES 1 and 2).
| Source of variation | df | Averagea | %Rb | %Ib | |||
| MS | F | MS | F | MS | F | ||
| Replication | 3 | 0.0066 | 1.45 ns | 0.0180 | 4.31 * | 0.00950 | 3.17 * |
| Treatment | 2 | 0.1460 | 32.00 ** | 0.1450 | 34.69 ** | 0.09540 | 31.71 ** |
| Site | 1 | 0.0032 | 0.70 ns | 0.0750 | 17.83 ** | 0.38990 | 12.96 ** |
| Planting dates | 1 | 0.0295 | 6.47 * | 0.0033 | 0.79 ns | 0.00350 | 1.19 ns |
| Site × planting dates | 1 | 0.1641 | 35.99 ** | 0.0348 | 8.28 ** | 0.02947 | 9.79 ** |
| Site × treatment | 2 | 0.0253 | 5.55 ** | 0.0254 | 6.05 ** | 0.01797 | 5.97 ** |
| Planting dates × treatment | 2 | 0.0061 | 1.35 ns | 0.0104 | 2.48 ns | 0.00830 | 2.78 ns |
| Error | 35 | 0.0045 | | 0.0042 | | 0.00300 | |
| CV | | 4.45 | | 5.76 | | 9.82 | |
a. ANOVA with data transformed by the root of (x + 0.5).
b. ANOVA with data transformed by the arcosine of the root of (x + 0.05).
Tables 5-9 present the analyses of variance made for the trait resistance to Bl. The data had responded to assumptions of homogeneity of variance. As such, they are first presented in the combination analysis (Table 5), and then in the simpler analyses, that is, by site (Table 7) and by individual experiment (Tables 8 and 9). Both experiments (planted on different dates) conducted at CES are presented in Table 8, and those carried out at PES are presented in Table 9.
For the trait resistance to NBl, the analyses of variance are presented only by site (Table 10) and by individual experiment (Tables 11 and 12). The transformations of data for each analysis were carried out, as described in the respective table footnotes.
The results are presented in terms of the mean of the levels of incidence of disease (‘Average’), and also of percentage of resistant plants (plants scoring between 0 and 3, i.e. %R) and of intermediately resistant plants (plants scoring between 4 and 5, i.e. %I). Thus, we could also compare their informativeness. We omitted the analyses of percentage of susceptible plants (%S), that is, those plants scoring more than 5, as these values were very infrequent. However, at the same time, those values that resulted from summing %R and %I served indirectly to provide an idea of the reduction over generations in the number of susceptible plants. The indirect manner should be understood as 100% minus the values of %R added to the value of %I.
Table 6. Values of absolute (Gs) and percentage (%Gs) genetic gain for resistance to leaf blast for the average level of incidence of disease, percentage of resistant plants (%R) and percentage of intermediately resistant plants (%I) in rice population CNA-7 across treatments cycle 0 (C0), 1 (C1) and 2 (C2). Data obtained from experiments conducted at the Capivara and Palmital Experiment Stations, Brazil, over two planting dates (CES 1 and 2, and PES 1 and 2).
| | Genetic gain | Experiment | Overall mean | ||||||
| CES | PES | ||||||||
| 1 | 2 | Mean | 1 | 2 | Mean | ||||
| Averagea | | | | | | | | | |
| | (C0:C1)b | Gs | 0.63 | 0.58 | 0.60 | -0.03 | 0.32 | 0.14 | 0.37 * |
| (C1:C2)c | Gs | -0.11 | 0.12 | 0.01 | 0.44 | 0.35 | 0.40 | 0.20 | |
| Total5 | Gs | 0.52 | 0.70 | 0.61 | 0.41 | 0.67 | 0.54 | 0.57 | |
| %Ra | | | | | | | | | |
| | (C0:C1)b | Gs | 0.12 | 0.20 | 0.16 | 0.03 | 0.06 | 0.05 | 0.11 |
| (C1:C2)c | Gs | 0.03 | -0.04 | 0.00 | 0.08 | 0.08 | 0.07 | 0.04 | |
| Totald | Gs | 0.09 | 0.24 | 0.16 | 0.11 | 0.14 | 0.12 | 0.15 | |
| %Ia | | | | | | | | | |
| | (C0:C1)b | Gs | -0.11 | -0.20 | -0.15 | -0.03 | -0.05 | -0.04- | -0.10 |
| (C1:C2)c | Gs | 0.03 | -0.03 | 0.00 | -0.08 | -0.08 | -0.07- | -0.03 | |
| Totald | Gs | -0.18 | -0.14 | -0.16 | -0.23 | -0.16 | -0.20 | -0.18 | |
a. Genetic gains calculated on the basis of original data. * refers to statistically significant at 95% probability; ns, not significant, according to Duncan’s test.
b. Genetic gain from C0 to C1 in real terms (x) and in percentage terms with respect to C0.
c. Genetic gain from C1 to C2 in real terms (x) and in percentage terms with respect to C0.
d. Total genetic gain (from C0 to C2) in real terms (x) and in percentage terms with respect to C0.
Table 7. Mean squares (MS) from the analysis of variance by site and coefficients of variation (CV) for the average level of incidence of disease, percentage of resistant plants (%R), and percentage of intermediately resistant plants (%I) for the trait resistance to leaf blast in rice population CNA-7. Data obtained from experiments conducted at the Capivara and Palmital Experiment Stations, Brazil, over two planting dates (CES 1 and 2 and PES 1 and 2)
| Source of variation | df | Averagea | % Rb | % Ib | ||||
| | | MS | F | MS | F | MS | F | |
| Capivara Experiment Station: first and second planting dates | ||||||||
| | Replication | 3 | 0.0032 | 0.91 ns | 0.0135 | 2.95 ns | 0.0057 | 1.84 ns |
| | Treatment | 2 | 0.0958 | 26.76 ** | 0.1193 | 26.00 ** | 0.0781 | 24.94 * |
| | Planting dates | 1 | 0.0293 | 8.18 ** | 0.0083 | 1.81 ns | 0.0062 | 1.99 ns |
| Error | 17 | 0.0036 | | 0.0046 | | 0.0031 | | |
| CV | | 3.92 | | 5.81 | | 10.56 | | |
| Palmital Experiment Station: first and second planting dates | ||||||||
| | Replication | 3 | 0.0047 | 0.77 ns | 0.0090 | 2.00 ns | 0.0066 | 1.86 ns |
| | Treatment | 2 | 0.0713 | 11.48 ** | 0.0519 | 11.51 ** | 0.0353 | 9.95 ** |
| | Planting dates | 1 | 0.1667 | 26.82 ** | 0.0298 | 6.61 * | 0.0268 | 7.56 * |
| Error | 17 | 0.0062 | | 0.0045 | | 0.0035 | | |
| CV | | 5.22 | | 6.19 | | 10.14 | | |
a. ANOVA with data transformed by the root of (x + 0.5).
b. ANOVA with data transformed by the arcosine of the root of (x + 0.05).
Table 8. Mean squares (MS) of the analysis of variance by individual experiment and coefficients of variation (CV) for the average level of incidence of disease, percentage of resistant plants (%R) and percentage of intermediately resistant plants (%I) for the trait resistance to leaf blast in rice population CNA-7. Data obtained from experiments conducted at the Capivara Experiment Station, Brazil, over two planting dates.
| Source of variation | df | Averagea | %Rb | %Ib | ||||
| MS | F | MS | F | MS | F | |||
| First planting date | ||||||||
| | Replication | 3 | 0.0048 | 1.06 ns | 0.0090 | 3.37 ns | 0.0048 | 3.08 ns |
| Treatment | 2 | 0.0485 | 10.65 ** | 0.0302 | 10.74 ** | 0.0180 | 11.48 ** | |
| Error | 6 | 0.0046 | | 0.0028 | | 0.0016 | | |
| CV | | 4.52 | | 4.48 | | 7.71 | | |
| Mean | | 1.49 | | 1.18 | | 0.51 | | |
| Second planting date | ||||||||
| | Replication | 3 | 0.0032 | 1.37 ns | 0.0071 | 1.90 ns | 0.0032 | 1.40 ns |
| Treatment | 2 | 0.0546 | 23.30 ** | 0.1030 | 27.60 * | 0.0717 | 31.32 ** | |
| Error 6 | | 0.0023 | | 0.0037 | | 0.0022 | | |
| CV | | 3.10 | | 5.35 | | 8.76 | | |
| Mean | | 1.56 | | 1.14 | | 0.55 | | |
a. ANOVA with data transformed by the root of (x + 0.5).
b. ANOVA with data transformed by the arcosine of the root of (x + 0.05).
Table 9. Mean squares (MS) of the analysis of variance by individual experiment and coefficients of variation (CV) for the average level of incidence of disease, percentage of resistant plants (%R) and percentage of intermediately resistant plants (%I) for the trait resistance to leaf blast in rice population CNA-7. Data obtained from experiments conducted at the Palmital Experiment Station, Brazil, over two planting dates.
| Source of variation | df | Meana | %Rb | %Ib | ||||
| CM | F | CM | F | CM | F | |||
| First planting date | ||||||||
| | Replication | 3 | 0.0072 | 2.93 ns | 0.0117 | 1.89 ns | 0.0099 | 1.92 ns |
| Treatment | 2 | 0.0240 | 9.78 * | 0.0219 | 3.53 ns | 0.0145 | 2.80 ns | |
| Error | 6 | 0.0024 | | 0.0062 | | 0.0052 | | |
| CV | | 3.12 | | 7.50 | | 11.62 | | |
| Mean | | 1.59 | | 1.05 | | 0.62 | | |
| Second planting date | ||||||||
| | Replication | 3 | 0.0031 | 0.33 ns | 0.0042 | 1.44 ns | 0.0016 | 0.77 ns |
| Treatment | 2 | 0.0552 | 5.82 ns | 0.0307 | 10.67 ** | 0.0213 | 9.90 * | |
| Error | 6 | 0.0095 | | 0.0028 | | 0.0020 | | |
| CV | | 6.85 | | 4.79 | | 8.37 | | |
| Mean | | 1.43 | | 1.12 | | 0.55 | | |
a. ANOVA with data transformed by the root of (x + 0.5).
b. ANOVA with data transformed by the arcosine of the root of (x + 0.05).
Table 10. Mean squares (MS) of the analysis of variance by site and coefficients of variation (CV) for the average level of incidence of disease, percentage of resistant plants (%R) and percentage of intermediately resistant plants (%I) for the trait resistance to neck blast in rice population CNA-7. Data obtained from experiments conducted at the Capivara and Palmital Experiment Stations, Brazil, for two planting dates
| Source of variation | df | Averagea | %Rb | %Ib | ||||
| MS | F | MS | F | MS | F | |||
| Capivara Experiment Station: first and second planting dates | ||||||||
| | Replication | 3 | 0.0100 | 1.21 ns | 0.0049 | 0.54 ns | 0.0009 | 0.62 ns |
| Treatment | 2 | 0.0547 | 6.60 ** | 0.0067 | 0.74 ns | 0.0022 | 1.51 ns | |
| Planting date | 1 | 0.1197 | 14.45 ** | 0.0021 | 2.24 ns | 0.0108 | 7.42 * | |
| Error | 17 | 0.0082 | | 0.0096 | | 0.0014 | | |
| CV | | 9.28 | | 6.90 | | 13.29 | | |
| Palmital Experiment Station: first and second planting dates | ||||||||
| | Replication | 3 | 0.0098 | 0.47 ns | 0.0018 | 0.29 ns | 0.0003 | 0.12 ns |
| Treatment | 2 | 0.0590 | 2.82 ns | 0.0208 | 3.19 ns | 0.0086 | 3.16 ns | |
| Planting date | 1 | 0.1221 | 5.84 * | 0.0429 | 6.58 * | 0.0174 | 6.33 * | |
| Error | 17 | 0.0209 | | 0.0065 | | 0.0027 | | |
| CV | | 10.47 | | 6.52 | | 13.26 | | |
a. ANOVA with data transformed by the root of (x + 0.5).
b. ANOVA with data transformed by the arcosine of the root of (x + 0.05).
Table 11. Mean squares (MS) of the analysis of variance by individual experiment and coefficients of variation (CV) for the average level of incidence of disease, percentage of resistant plants (%R) and percentage of intermediately resistant plants (%I) for the trait resistance to neck blast in rice population CNA-7. Data obtained from experiments conducted at the Capivara Experiment Station, Brazil, for two planting dates.
| Source of variation | df | Averagea | %Rb | %Ib | ||||
| MS | F | MS | F | MS | F | |||
| First planting date | ||||||||
| | Replication | 3 | 0.0178 | 2.59 ns | 0.0044 | 0.43 ns | 0.0021 | 0.81 ns |
| Treatment | 2 | 0.073 | 10.75 * | 0.0098 | 0.97 ns | 0.0019 | 0.74 ns | |
| Error | 6 | 0.0068 | | 0.010 | | 0.0026 | | |
| CV | | 7.88 | | 7.33 | | 16.56 | | |
| Mean | | 1.05 | | 1.37 | | 0.31 | | |
| Second planting date | ||||||||
| | Replication | 3 | 0.0025 | 0.88 ns | 0.00008 | 0.32 ns | 0.0007 | 1.88 ns |
| Treatment | 2 | 0.0064 | 2.23 ns | 0.0003 | 1.20 ns | 0.0009 | 2.47 ns | |
| Error | 6 | 0.0029 | | 0.002 | | 0.003 | | |
| CV | | 5.93 | | 1.63 | | 7.15 | | |
| Mean | | 0.91 | | 0.96 | | 0.26 | | |
a. ANOVA with data transformed by the root of (x + 0.5).
b. ANOVA with data transformed by the arcosine of the root of (x + 0.05).
Table 12. Mean squares (MS) of the analysis of variance by individual experiment and coefficients of variation (CV) for average level of incidence of disease, percentage of resistant plants (%R) and percentage of intermediately resistant plants (%I) for the trait resistance to neck blast in rice population CNA-7. Data obtained from experiments conducted at the Palmital Experiment Station, Brazil, for two planting dates.
| Source of variation | df | Averagea | %Rb | %Ib | |||
| MS | F | MS | F | MS | F | ||
| First planting date | |||||||
| Replication | 3 | 0.0215 | 1.30 ns | 0.0047 | 0.94 ns | 0.0016 | 1.98 ns |
| Treatment | 2 | 0.0270 | 1.67 ns | 0.0109 | 2.17 ns | 0.0104 | 12.81 ** |
| Error | 6 | 0.0160 | | 0.005 | | 0.0008 | |
| CV | | 9.85 | | 5.55 | | 7.74 | |
| Mean | | 1.31 | | 1.27 | | 0.36 | |
| Second planting date | |||||||
| Replication | 3 | 0.0083 | 0.26 ns | 0.0034 | 0.33 ns | 0.0010 | 0.22 ns |
| Treatment | 2 | 0.0317 | 0.98 ns | 0.0099 | 0.96 ns | 0.0138 | 0.29 ns |
| Error | 6 | 0.0324 | | 0.0102 | | 0.0047 | |
| CV | | 12.39 | | 8.48 | | 16.32 | |
a. ANOVA with data transformed by the root of (x + 0.5).
b. ANOVA with data transformed by the arcosine of the root of (x + 0.05)
Figure 1. Linear regression of resistance to leaf blast in rice population CNA-7 across cycles 0 (C0), 1 (C1) and 2 (C2) of the improvement programme. Value ‘b’ of the linear regression equation represents the heritability index estimated for [A] average level of incidence of disease (‘Average’; y=0.35x), [B] percentage of resistant plants (%R; y=0.50x), and [C] percentage of intermediately resistant plants (%I; y=0.29x)
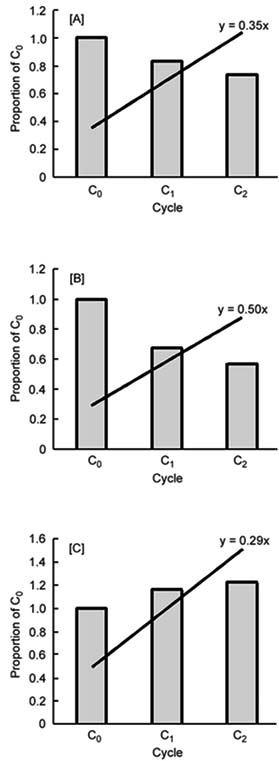
Table 6 presents values for the genetic gain obtained for Bl. Gains are considered statistically significant when treatments differ among themselves according to Duncan’s test. The positive values indicate increases in resistance, scored in descending order, where 0 is resistant and 9 is susceptible. That is, increased resistance is represented by a smaller number for the mean value or %I. For the trait resistance to NBl, results for genetic gain are presented throughout the text, as little increase in resistance was observed.
For the trait resistance to Bl, Figure 1 shows the linear regression of the data for gain in the cycles. Using this information, heritability was also calculated. This datum was calculated only for Bl with the data used for the combination analysis, that is, with all data obtained.
Leaf blast (Bl)
Table 3 presents the original values obtained from the analysis of 200 plants per plot for the trait resistance to Bl. A preliminary analysis confirms that the entire population CNA-7 already showed strong resistance to leaf blast in C0 at the beginning of the improvement programme. This indicates that the selecion of parental materials used as sources of resistance had been efficient. This is seen in the values 2.13, 1.76 and 1.56 in row ‘Overall mean’ (Table 3) with column ‘Average’ for C0, C1 and C2, respectively. Considering that the evaluation scale for resistance varies from 0 (totally resistant) to 9 (susceptible), these values can be regarded as low. Moreover, in row ‘Overall mean’ with column ‘%R’ (Table 3), the idea is confirmed by the values 0.67, 0.78 and 0.82 for C0, C1 and C2, respectively. The hypothesis that selection pressure was very low during the experiments’ execution is ruled out because a high number of susceptible plants in the inoculum spreader rows were observed as diseased (data not shown).
Interestingly, analysis of another type of data (mean or %) can lead to different conclusions in some cases, for example, the comparison between sites carried out according to the mean values of each site. When the comparison was based on the mean values for level of incidence of disease, no significant differences could be detected between CES and PES. However, when the analysis took into account the percentage of resistant or intermediately resistant plants, statistically, most of the resistant plants were found in CES (78% versus 73% at PES). To confirm these differences in Table 3, it suffices to compare, in the columns, the boldface values followed by capital letters.
The possible explanations for the difference between the two types of analyses would be that, in calculating the means, the extreme values are placed in an intermediate class on considering their frequencies. At PES, plants were observed with higher levels of incidence (i.e. plants were extremely sick, scoring 7 or 9), but at low frequencies. At CES, a larger number of resistant plants were found. By calculating the means, those differences became imperceptible. From a didactic viewpoint, this could be explained by the example that, at CES, four plants would score 3, 3, 3 and 5 for level of incidence, which would suggest 75% of plants are resistant, and, at PES, another four plants would score 0, 0, 7 and 7, which would suggest 50% are resistant. If the average of both sites is taken, then they each have an average of 3.5 but, in percentage terms, they are different. Based on this evidence, we could suggest that, in this case, the analysis of the data for percentages of resistance were much more informative than the data for means. This assertion, however, does not seem to be unanimously accepted in the literature as the mean is mostly used to describe resistance (Fillipi and Prabhu, 1997).
With reference to the two previous points discussed above (high resistance, which indicates good selection of parents, and the types of data that present more information), the results of genetic gain for resistance to Bl are presented in the population across the recurrent selection cycles.
In general terms, increase in resistance across the cycles was readily noted for Bl. The results of the combined analyses of variance indicated that highly significant differences exist both between treatments (C0, C1, C2) and the analysis of the mean such as for %R and %I (Table 5). Table 6 present the values that measure what gains were made for resistance. Considering the calculations in terms of overall mean of levels, we can see that, from C0 to C1, a gain in resistance of 17.37% occurred with respect to C0; and from C1 to C2, one of 9.39%, with respect to C0. Such values can be observed in the column ‘Overall mean’ in Table 6. These percentages change to 16.42% and 5.97% if the values of %R are considered (Table 6, column ‘Overall mean’ with row ‘%R’). As can be observed, the gains in the initial cycles are greater than in the subsequent ones.
Another noteworthy aspect is that the gains made in resistance did not follow the same pattern for the different sites, as seen in the significant interaction between site and treatment in the combination ANOVA made for CES (Table 5). This would be the same as saying that, at CES, a significant gain of 26.79% occurred from C0 to C1, whereas the gain from C1 to the following was insignificant (Table 6). At PES, exactly the reverse occurred: the gain from C0 to C1 was insignificant, whereas the gain of 19.80% from C1 to C2 was significant. Two hypotheses may explain this event:
(1) Across the cycles, not only would the principal genes correlating with resistance to the specific fungal races occurring at CES (the site where the selections were carried out) be accumulated, but also secondary genes, which could confer resistance to a broader spectrum of races
(2) Across the cycles, only the principal genes would be accumulated through selection of plants scoring only between 0 and 3.
With the first hypothesis, the increase in genetic gain in C2 at PES would be explained by improved combinations of favourable genes across the cycles, because a greater possibility had existed of epistatic interactions occurring between accumulated principal and secondary genes. This would permit the population to respond favourably not only to the pressure of ‘known’ fungi (which would be the fungi occurring at CES where selection was conducted), but also to ‘unknown’ ones (which would be the supposedly new races occurring at PES for which the population had not been selected).
With the second hypothesis, the explanation for genetic gain in C2 being greater at PES than at CES would be that, at the latter, resistance would already have reached such a high level in C1 that obtaining gain in the following cycles would be much more difficult. Hence, to detect gain, other, more precise, alternatives of experimental evaluation would be needed. Given that, at PES, gain in C1 was not large, an increase would be much more likely.
With this difference between the sites, the values of total gain obtained at the two sites during the two cycles (Table 6) clearly show the efficiency of the selection strategy used within the recurrent selection programme to increase resistance to Bl in population CNA-7. At CES, total genetic gain was 27.23% and, at PES, 26.73% for the average of levels of incidence; and for %R, 23.53% and 17.91%, respectively. These increases can be considered as high when comparing them with the findings by Ceballos et al. (1991), but as intermediate if compared with those of Díaz-Lago et al. (2002), who had obtained gains ranging between 41% and 64%.
The highly significant interactions between site and planting date in the combination analysis (Table 5) led to the analysis of data by site (Table 7). At both CES and PES, we could con- firm the significant difference between planting dates (8.18 and 26.82, respectively), which confirmed the need to understand that population dynamics of diseases comprise a factor to take into account. An example of applying this type of knowledge is that of Prabhu et al. (2001) who proposed choosing the planting date for the commercial varieties. These arguments strengthen the idea that the strategy of selection adopted in the management of population CNA-7 was adequate because the time of selection could be made to coincide with high disease pressure. If, with a difference of 10 days in planting from one season to another already confirmed significant interaction in responses, then surely this is an issue that should be studied more in depth. Since 1970, the intention of identifying and understanding fungal population dynamics was demonstrated by an attempt to develop a simple mechanism of capturing fungi in the air (Yamaguchi, 1970).
The differences between treatments (i.e. C0, C1 and C2, already presented) can also be verified in Tables 8 and 9 in which the analyses of variance are presented for each experiment. Their analyses reveal that the values for the CVs ranged from 3.10% to 11.62%. The highest CVs were for the data for %I, and no significant differences existed between replications. Comparison of errors allowed the combination analysis of the data (Table 5).
The calculations of heritability carried out for the trait resistance to Bl are presented in Figure 1, based on linear regressions from the data. The values of heritability of 0.35, 0.50 and 0.29 were obtained for the average level of incidence, %I and %R, respectively.
The data obtained for population CNA-7 were verified as being higher than those of Filippi and Prabhu (1997) for whom heritabilities fluctuated between 0.16 and 0.26. A possible explanation for the difference is that, in CNA-7, the strategy of selecting plants scoring between 0 and 3 could rescue a larger number of principal genes when compared with the strategy used for the other population, which was to select plants with partial resistance, that is, scoring ³4 on the IRRI scale (1988).
Neck blast (NBl)
Table 4, including analyses for the trait resistance to NBl, presents data for 200 plants per experiment for the average of the level of incidence of disease, %R and %I. The letters represent results of Duncan’s tests at 95% probability, with the same letters representing statistical equality between treatments. Those cases without letters lacked criteria for homocedasticity of variances that would have made the analyses possible.
Although gain in resistance to NBl seems to have occurred at PES, as suggested by the data in Table 4 (1.62, 1.51, 1.16), the individual variance analyses could not verify this statistically. Unlike the analysis for the trait resistance to Bl (already presented) for which we could show a combination analysis of the data, the analyses for NBl had to be done separately for site and experiment.
For the experiments carried out at both CES and PES, we highlight the importance of planting date for evaluating the trait resistance to NBl, when a significant difference in the source of variation ‘season’ is detected in the analysis of variance (14.45 and 5.84, respectively, Table 10). The data for the means in Table 4, for example, point out that, at CES, the mean for the first season (CES-1) was 0.62, whereas, for the second (CES-2), it was 0.33. These data corroborate with Ou’s suggestion (1985) that, for the trait resistance to NBl in particular, planting date appears to have great influence.
If we add the data for %R and %I (Table 4) for each cycle, we can indirectly see that, in C0, population CNA-7 already presented a low degree of susceptibility. This indicates that, for NBl, the selection of parental materials was also good. This calculation was obtained by adding the mean value for %R in C0 with the mean value for %I in C0 at CES (0.94 + 0.03), equalling 0.97. As a result, the 0.03 that is left over to make up the 100% represents the percentage of susceptible plants found in C0 at CES.
For the trait resistance to NBl, in contrast to that for Bl, we could not demonstrate if the mean values or the percentages were more adequate for use in this type of analysis.
With respect to the analyses of variance per experiment (Tables 11 and 12), few cases presented significant differences among treatments, as the comparison of letters in the row ‘Mean at CES’ in Table 4 shows clearly. With the means, which fluctuated between 0.39, 0.68 and 0.37 across the cycles, we could calculate the genetic gains and confirm that, only at CES, did resistance to NBl in the population decline in the first cycle (GsC0:C1 = -74%) and afterwards increased again in the second cycle (GsC1:C2 = +79%) for the mean. The impossibility of calculating gains for other traits indicates that we could not detect, with statistical reliability, gain for resistance to NBl in population CNA-7, using the selection strategy already described.
The data indicate, as a result, that the selection strategy adopted was not efficient for improving the trait resistance to NBl within population CNA-7. An explanation may be found in the following factors:
Problems in evaluation
One factor would be a result of the analysis of the trait resistance to NBl being based on the percentage of sterile grains. This makes it easy to confuse, at evaluation, symptoms of disease with inherited male sterility in the population (Guimarães et al., 1995).
Another, possibly influencing, factor would be the evaluation scale for NBl, which describes the score of 0 as ‘no symptoms’, 1 as ‘less than 5% of infected panicles’ and 3 as ‘5% to 10% of infected panicles’. Being exact may have been difficult during evaluation.
A further difficulty in evaluating the trait resistance to NBl appears in the mesh houses. For example, A.S. Prabhu (personal communication, 2002) comments that an adequately efficient methodology for inoculation is still being sought. Filippi and Prabhu (1997), for example, suggest that alternative systems for evaluating NBl and Bl be researched and developed.
Influence of the environment
Another factor that may have prevented detection of genetic gain for the trait resistance to NBl is the considerable influence of environment during data evaluation. With respect to environment, CES is the usual site for planting upland materials, whereas irrigated rice is normally planted at PES. The fungal races that evolved in one site would be expected to differ from those evolved in the other site. Differences between CES and PES could not be statistically verified in this experiment, as the analyses did not fulfil the assumption of homogeneity of variances. With respect to planting date, the trait resistance to NBl is known to be more sensitive than that for resistance to Bl (Ou, 1985; Veillet et al., 1996). All these environmental influences could be caused by different frequencies or distributions of races of the pathogen across site and season.
Comparing data for CNA-7 in the 2001/02 experiment with the 1997/98 data for the S0:2 families, Badan et al. (2000) noted that, in that season the average for C0 was 5.02, whereas during our study it was much lower, which further strengthens the hypothesis of environmental influence.
Several studies corroborate this idea. Alvarez (1995), for example, justifies the lack of genetic gain in resistance in the population he studied by a supposed change in the pathogen population from one year to the next in the site where the evaluations were carried out. Gatica (1993), working with a maize population, also supposes an alteration in the pathogen population from one environment to another.
Another possibility would be an unequal distribution of disease in the field, which would increase experimental error and hinder demarcation among treatments.
Selection strategy
The strategy of truncated selection for plants scoring less than 3, the same as used for population GC-91, had already worked: in 1995, Guimarães et al. (1995) succeeded in increasing the resistance to blast in terms of %R, from 21.11% (C0) to 36.78% (C1) and, hence, the strategy was expected to continue functioning. In any case, consulting a bibliography of the genetics of Bl and NBl would yield other ideas of how this would work or if different selection strategies exert different types of influence.
Simultaneous selection for resistance to Bl and NBl
The simultaneous selection of several traits is a complicated task. Hence, on creating population CNA-7, the idea was to first guarantee the acquisition of resistance, and then select for other traits of interest as variation in the population would remain at an adequate level, or the created population could serve as a basis for new crosses.
Despite the trait resistance to Bl being seen as only one, the different ways of attack by the disease are regarded as different phases, that is, the resistance to Bl and resistance to NBl (Veillet et al., 1996), even in the various improvement programmes that always select for them separately.
So far, in the literature, the genetic correlations among them are not clear. Bonmann et al. (1989) found positive correlations between Bl and NBl. In the same population CNA-7, with which they currently work, a positive association was found between the trait resistance to Bl and resistance to NBl (Badan et al., 2001), which meant that most of the S0:1 lines evaluated in 2000 were as resistant to Bl as to NBl. However, it should be pointed out that, when the same selection strategy was used, gain was observed for the trait resistance to Bl but not for that to NBl.
Would the intra- or interallelic interactions be influencing these results, or can these results be attributed only to environmental effects or poor evaluation, as previously described?
Veillet et al. (1996), on analysing population CNA-IRAT 5, suggested that the positive heterosis found led to the conclusion that hybrids would always be more resistant to Bl than pure lines, regardless of the selection method used. They also explained that the effects of dominance could not explain heterosis for Bl. For NBl, it was impossible to clearly explain its effects only on the basis of components in resistance in the leaf. Hence, it would be possible to believe that the trait resistance to NBl would have greater influence on the interaction of dominant genes, which would provide greater heterosis. In contrast, for the trait resistance to Bl, the additive effect of the genes would already be efficient so that the recurrent selection would also be efficient. These suggestions should be clarified in future research.
Another important factor may be that the type of family in which the evaluations are being carried out. Family type may perhaps influence the type of observed reaction. When S0:1 families are evaluated, these present a much larger number of homozygotes than S0 families. Could the heterozygotes be responsible for resistance to NBl?
A further assumption is that of interallelic interactions. The selection strategy used may possibly be already eliminating important alleles as selection for principal genes is known to eliminate secondary genes (Van der Plank, 1978). Would secondary genes be significantly important for the trait resistance to NBl?
Our study have confirmed that population CNA-7 presented good increases in the degree of resistance to Bl across selection cycles, when using the strategy of selecting plants scoring 0-3 under strong inoculum pressure in the field. However, the same did not occur for the trait resistance to NBl. The methodology for evaluating and analysing NBl data needs to be enhanced. One suggestion would be the cartographic analysis of variance to attempt to reduce, as far as possible, the environmental effect (Duarte, 2000), or to seek other alternatives such as those proposed by Díaz- Lago et al. (2002).
The low levels of incidence of disease, as much for Bl as for NBl, indicate that the selection of parental materials was efficient enough in the sense of increasing resistance in the population. With the existing level, population CNA-7 can be immediately used to select for other traits, and to use as a source of new parental materials for other crosses.
The population’s different performance at the two sites for the trait resistance to Bl indicates that durability of resistance is perhaps another factor that should be attended to in the population.
Acknowledgements
The authors thank Drs Anne S. Prabhu and Rosana Figueroa for their valuable help during the management and analysis of the study.
References
Alvarez, R. 1995. Evaluación de dos ciclos de selección recurrente en una población de maíz resistente al gusano cogollero (Spodoptera frugiperda). Maracay, Universidad Central de Venezuela. 74 pp. (MSc thesis).
Amézquita, M.C.; Guimarães, E.P.; Correa-Victoria, F.J. & Lema, G. 1996. Análise de dados categóricos, 2: Uso de um modelo logístico para avaliação de progresso genético para resistência à brusone. In B.S. Pinheiro & E.P. Guimarães, eds. Arroz na América Latina: Perspectivas para o incremento da produção e do potencial produtivo. Goiânia, GO, Brazil, Centro Nacional de Pesquisa de Arroz e Feijão (CNPAF) of EMBRAPA. pp. 66.
Badan, A.C.C.; Geraldi, I.O.; Guimarães, E.P. & Ospina, Y. 1998. Estimativa do tamanho efetivo de amostra ideal para caracterizar uma população de arroz para as características peso de panículas e peso de 100 grãos. Genet. Mol. Biol., 21: 246.
Badan, A.C.C.; Guimarães, E.P. & Prabhu, A.S. 2000. Recurrent selection to develop blast resistant lines in rice. In Durable Resistance Symposium. Wageningen, Netherlands, Wageningen University and Research Centre. p. 143.
Badan, A.C.C.; Guimarães, E.P.; Prabhu, A.S. & Zimmermann, F.J.P. 2001. Associação entre brusone na folha e na panícula em arroz de terras altas. In Congresso de melhoramento genético de plantas, Goiânia, GO, Brasil. (Available at http://www.sbmp.org.br/cbmp2001/area1/01Resumo50.htm)
Bauske, E.M.; Kolb, F.L.; Hewings, A.D. & Cisar, G. 1994. Modified recurrent selection for barley yellow dwarf virus tolerance in winter wheat. Crop Sci., 34(2): 371-375.
Bonmann, J.M.; Estrada, B.A. & Bandong, J.M. 1989. Leaf and neck blast resistance in tropical lowland rice cultivars. Plant Dis., 73(5): 388-390.
Breseghello, F.; Rangel, P.H.N. & Morais, O.P. de. 1999. Ganho de produtividade pelo melhoramento genético do arroz irrigado no nordeste do Brasil. Pesq. Agropecu. Brasil., 34(3): 399-407.
Ceballos, H. n.d. Genética cuantitativa y fitomejoramiento. Palmira, Universidad Nacional de Colombia.
Ceballos, H.; Deutsch, J.A. & Gutiérrez, H. 1991. Recurrent selection for resistance to Exserohilum turcicum in eight subtropical maize populations. Crop Sci., 31: 964-971.
Châtel, M. & Guimarães, E.P. 1998. Catalogue registration to manage rice gene pool and population improvement. Cali, Colombia, CIRAD/CIAT Rice Project, CIRAD-CA & CIAT. (CD-ROM).
Correa-Victoria, F.J.; Guimarães, E.P. & Martínez, C.P. 1997. Caracterización de la estructura genética y la virulencia de Pyricularia grisea Sacc. para desarrollar variedades resistentes al añublo del arroz. In E.P. Guimarães, ed. Selección recurrente en arroz, pp. 203-215. Cali, Colombia, CIAT.
Courtois, B.; Nelson, R. & Roumen, E. 1997. Creación de un acervo genético para mejorar la resistencia parcial a la Piricularia en el arroz de secano, mediante selección recurrente. In E.P. Guimarães, ed. Selección recurrente en arroz, pp. 189-202. Cali, Colombia, CIAT.
Díaz-Lago, J.E.; Stuthman, D.D. & Abadie, T.E. 2002. Recurrent selection for partial resístance to crown rust in oat. Crop Sci., 42: 1475-1482.
Duarte, J.B. 2000. Sobre o emprego e a análise estatística do delineamento em blocos aumentados no melhoramento genético vegetal. Piracicaba, SP, Brazil, Escola Superior Agricultura ‘Luiz de Queiroz’. 293 pp. (PhD dissertation)
Falconer, D.S. 1968. Introduction to quantitative genetics. Glasgow, Scotland, MacLohose and Co. 365 pp.
Filippi, M.C. & Prabhu, A.S. 1997. Selección recurrente para resistencia parcial a Pyricularia grisea Sacc. en arroz en Brasil. In E.P. Guimarães, ed. Selección recurrente en arroz, pp. 177-187. Cali, Colombia, CIAT.
Frohlich, G. & Rodewald, W. 1970. Enfermedades de las plantas tropicales. Uteha, México, Disipación y Lucha. pp. 151-153.
García, P.J. 1995. Efectos de la selección recurrente de familia de hermanos completos sobre poblaciones de maíz (Zea mays L.). Maracay, Universidad Central de Venezuela. 89 pp. (MSc thesis)
Gatica, H. 1993. Evaluación de cuatro ciclos de selección recurrente en una población de maíz resistente a ‘punta loca’. Maracay, Universidad Central de Venezuela. 58 pp. (MSc thesis)
Guimarães, E.P. & Correa-Victoria, F.J. 1997. Utilización de la selección recurrente para desarrollar resistencia a Pyricularia grisea Sacc. en arroz. In E.P. Guimarães, ed. Selección recurrente en arroz, pp. 165-175. Cali, Colombia, CIAT.
Guimarães, E.P.; Correa-Victoria, F.J. & Tulande, E. 1995. CG-91, a broad-based rice synthetic population for blast (Pyricularia grisea Sacc.) resistance. Rev. Brasil. Genét., 18(4): 533-561.
Hartley, H.O. 1950. The maximum F-ratio as a short-cut test for heterogeneity of variance. Biometrika, 37: 308-312.
IRRI (International Rice Research Institute). 1988. Standard evaluation system for rice. 3rd ed. Los Baños, Philippines. 54 pp.
Laurentin, H.E. 1996. Evaluación del efecto de dos ciclos de selección recurrente sobre el rendimiento en una población de ajonjolí (Sesamum indicum L.). Maracay, Universidad Central de Venezuela. 81 pp. (MSc thesis)
Leung, H. & Shi, Z. 1994. Genetic regulation of sporulation in the rice blast fungus. In R.S. Zeigler; S.A. Leong & P.S. Teng, eds. Rice blast disease, pp. 35-50. Los Baños, Philippines, International Rice Research Institute (IRRI).
Morais, O.P. de & Rangel, P.H.N. 1997. Melhoramento de arroz no Brasil. In A.F.B. Abreu; F.M.A. Gonçalvez; O.G. Marques, Jr. & P.H.E. Ribeiro, eds. Simpósio sobre atualização em genética e melhoramento de plantas, pp. 148-166. Lavras, MG, Brazil, Universidade Federal de Lavras (UFLA).
Morais, O.P. de; Zimmermann, F.J.P. & Rangel, P.H.N. 2000. Evaluación de ganancias observadas en selección recurrente. In E.P. Guimarães, ed. Avances en el mejoramiento poblacional en arroz, pp. 21-35. Santo Antônio de Goiás, Brazil, Embrapa Arroz e Feijão.
Notteghen, J.L. 1981. Cooperative experiment on horizontal resistance to rice blast. In International Rice Research Institute (IRRI). Blast and upland rice: report and recommendations from the meeting for international collaboration in upland rice improvement, pp. 43-51. Los Baños, Philippines.
Ou, S.H. 1985. Rice disease. 2nd ed. Wallingford, UK, CAB International. 380 pp.
Prabhu, A.S.; Filippi, M.C. & Ribeiro, A.S. 1999. Doenças e seu controle. In N.R.A. Vieira; A.B. Santos & E.P. Sant’ana, eds. A cultura do arroz no Brasil, pp. 262-307. Santo Antônio de Goiás, Brazil, Embrapa Arroz e Feijão.
Prabhu, A.S.; Guimarães, C.M. & Berni, R.F. 2001. Influência da época de plantio no controle da brusone en folhas de arroz de terras altas. Embrapa Arroz e Feijão. Pesquisa em Foco, no. 56. (Available at: http://www.cnpaf.embrapa.br/negocios/emfoco/pqfoc56.htm).
Salter, R.; Miller-Garvin, J.E. & Viana, D.R. 1994. Breeding for resistance to alfalfa root rot caused by Fusarium species. Crop Sci., 34(5): 1213-1217.
Santos, P.G.; Soares, P.C.; Soares, A.A.; Morais, O.P. de & Cornélio, V.M. de O. 1999. Avaliação do progresso genético obtido em 22 anos no melhoramento do arroz irrigado em Minas Gerais. Pesq. Agropecu. Brasil., 34(10): 1889-1896.
SAS Institute, Inc. 2000. User’s guide, version 8. Cary, NC, USA. (CD-ROM)
Soares, A.A.; Santos, P.G.; Morais, O.P. de; Soares, P.C.; Reis, M.S. & Souza, M.D. 1999. Progresso genético obtido pelo melhoramento do arroz de sequeiro em 21 anos de pesquisa em Minas Gerais. Pesq. Agropecu. Brasil., 34(3): 415-424.
Van der Plank, J.E. 1978. Genetic and molecular basis of plant pathogenesis. New York, Springer-Verlag. 167 pp.
Veillet, S.; Filippi, M.-C. & Gallais, A. 1996. Combined genetic analysis of partial blast resistance in an upland rice population and recurrent selection for line and hybrid values. Theor. Appl. Genet., 92: 644-653.
Vencovsky, R.; Morais, A.R.; Garcia, J.C. & Teixeira, N.M. 1986. Progresso genético em vinte anos de melhoramento do milho no Brasil. In Proc. 16th Congresso Nacional de Milho e Sorgo, Belo Horizonte, pp. 300-306. Sete Lagoas, MG, Brazil, Centro Nacional de Pesquisa de Milho e Sorgo (CNPMS) of EMBRAPA.
Yamaguchi, T. 1970. Forecasting techniques of rice blast. Jpn. Agric. Res. Q., 5: 26-30.
Yap, I. 2000. About rice blast. (Available at: http://ascus.plbr.cornell.edu/ blastdb/about.html).
| [27] Department of Genetics and Molecular Biology, Universidade Estadual de Campinas (UNICAMP), currently at Universidade Federal Rural de Pernambuco, Rua Dom Manoel de Medeiros, s/n - Dois Irm.s, Recife, Pernambuco, Brazil. Brazil. E-mail: [email protected] [28] Embrapa Arroz e Feijão, currently at FAO, Viale delle Termi di Caracalla, 00100 Rome. E-mail: [email protected] [29] Institute of Agronomy, Universidad Central de Venezuela, Maracay, Venezuela. E-mail: [email protected] |
![]()
![]()
![]()