![]()
![]()
![]()
Yolima Ospina[30]
Elcio Perpétuo Guimarães[31]
Marc Châtel[32]
Myriam Cristina Duque[30]
* Part of this study was carried out by the first author as thesis work towards a master’s degree from the Universidad Nacional de Colombia-Palmira, 2002.
Yolima Ospina
Abstract
To develop studies that allow in-depth understanding of how population improvement functions in rice is extremely useful for work currently being carried out in Latin America. This chapter describes the effect of selection and three recombinations (one before the selection cycle and two after it) in the upland-rice population PCT-4, developed for acid soils. To determine responses, the following variables were evaluated in two environments, that is, two treatments with different levels of dolomitic lime: reaction to soil acidity, number of days to 50% flowering (FLR), grain yield (GY), 10-panicle weight (PW10), number of filled grains (FG), number of empty grains (EG), plant height (PH), number of tillers per square metre (T/M2) and 1000-grain weight (GW1000). Values for FLR and EG were statistically smaller when less lime was applied; and those for GY, FG and PW10 were smaller when more lime was applied. The traits GY, PW10, EG, FG, PH, T/M2 and GW1000 did not perform differently after one cycle of recurrent selection. The effects of recombination were variable for GY and EG; two recombinations produced positive effects even though the contrary occurred for FLR. Three recombinations produced negative effects for FLR and GY, but were positive for PH. Generally, no clear-cut trend towards either positive or negative effects was observed. Thus, we can conclude that, for population PCT-4, no more than one recombination between recurrent selection cycles can be recommended.
Resumen
El desarrollo de estudios que permitan conocer más a fondo el funcionamiento del mejoramiento poblacional en arroz es extremadamente útil para los trabajos realizados en América Latina. Este capítulo presenta el efecto de la selección y de tres recombinaciones (una antes del ciclo de selección y dos después de la misma), en la población de arroz de secano PCT-4 desarrollada para adaptarse a suelos ácidos. Para determinar estas respuestas se evaluaron en dos ambientes o tratamientos de cal dolomítica las siguientes variables: reacción a la acidez; número de días a la floración del 50% de las panículas (FLR); rendimiento de grano (GY); peso de diez panículas (PW10); número de granos llenos (FG) y vacíos (EG); altura de plantas (PH); número de tallos por metro cuadrado (T/M2) y peso de mil granos (GW1000). Los datos de FLR y GV fueron estadísticamente menores cuando se aplicó menos cal y los de GY, FG y PW10 menores para el mayor nivel de cal. Las características GY, PW10, EG, FG, PH, T/M2 y GW1000 no presentaron cambios en sus comportamientos cuando se sometieron a un ciclo de selección recurrente. Los efectos de las recombinaciones fueron variables para GY y EG; dos recombinaciones produjeron efectos positivos no obstante que ocurrió lo contrario para FLR. Tres recombinaciones produjeron efectos negativos en la FLR y en el GY, y positivo en la PH. En general, no se observó una clara tendencia en la dirección de estos efectos lo cual permite concluir que para la PCT-4 no se recomienda hacer más que una recombinación entre ciclos de selección recurrente.
Historically, the improvement of autogamous plants has emphasized the use of conventional hybridization methods such as crosses and backcrosses between two, three, or four progenitors, and whose progenies are selected and brought to homozygosis through the pedigree, mass selection, or modified mass selection methods. Because of the difficulties in carrying out numerous manual crosses, population methods were almost never used to improve such crops (Fehr, 1987).
For rice, Fujimaki (1979) proposed the use of population improvement through recurrent selection, using male sterility. Châtel and Guimarães (1997) implemented it by developing several populations with broad genetic bases and disseminating them to rice genetic improvement programmes in Latin America.
According to Hull (1945), recurrent selection means selecting generation after generation that have the greatest possibilities of crosses between selected individuals to give the greatest possibilities of gene recombination. Thus, the frequency of favourable alleles and, hence, the probability of obtaining superior lines in an improved population would be increased. Because recurrent selection depends on many crosses or on allogamy during recombination, its application for improving autogamous species depends more on the species adapting to allogamy than on the method adapting to the autogamous species. The recessive male-sterility gene, discovered by Singh and Ikehashi (1981), is now being used in rice population improvement. It ensures that recombinations occur in a desirable way when populations are being created or recombination cycles conducted.
For the rice crop generally, plant breeders have used recurrent selection based on evaluating S0:2 families (Rangel and Neves, 1997). The S0:2 families originate from the selection carried out on fertile S0 plants of a base population. These plants have been subjected to two generations of self-fertilization and the resulting progeny evaluated. The best S0:2 are then selected to constitute the selection units. To obtain a recurrent selection cycle with this method, four cropping seasons are needed to:
(1) plant and select S0 plants
(2) advance the S0:1 generation
(3) evaluate the S0:2 (selection unit)
(4) recombine the best selection units.
Where only one cropping season per year is possible, and to advance the process, the S0:1 generation (recombination unit) can be cultivated and the recombination stage performed outside the normal cropping time in other sites.
This chapter presents the results of studies conducted to support programmes working with rice population improvement. The studies focused on understanding the response to selection for yield under acid-soil conditions, using three recombination cycles, one before and two after selection. This type of work seeks to broaden knowledge on population management, which is still a new and little-studied alternative for rice.
This work was carried out during the normal cropping season (first semester, 1999, April to August) at ‘La Libertad’ Experiment Station (LLES) of the Colombian Corporation of Agricultural Research (CORPOICA, Spanish acronym), Regional Office 8, located in Villavicencio, Department of Meta, Colombia. The site possesses highly acid soils with >70% aluminium saturation and deficiencies in elements such as phosphorus, potassium, magnesium, calcium, sulphur and sometimes zinc. The amount and distribution of rainfall are regular, with an average of 2000 mm per year, which is sufficient for rice requirements during the cropping season (Guimarães et al., 1996).
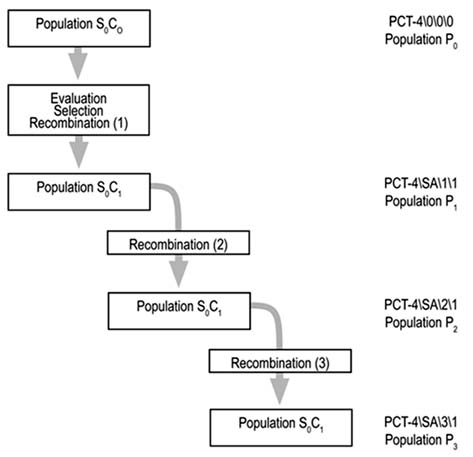
The rice population PCT-4\0\0\0, the base germplasm for this study, was created for the conditions of acid-soil savannahs through a collaborative effort between the international genetic- improvement programmes of CIAT (Cali, Colombia) and CIRAD (Montpellier, France). The strategy used for its formation and composition is based on population CNA-IRAT A and seven upland-rice lines, described by Châtel et al. (1997). From PCT-4\0\0\0, called P0 in this work, three populations were obtained: one by recombination before the selection cycle (P1) and two (P2 and P3) from two successive cycles of recombination after selection and based on S0:2 families.
These four populations were managed at CIAT’s Palmira Experiment Station (PES) between October 1997 and March 1998, and 44 fertile S0 plants (S0:1 seeds) were selected at random to represent each of the four populations (P0, P1, P2 and P3). Unfortunately, because few seeds were available, we could not have the minimum 200 plants that Geraldi and Souza (2000) recommended for representing populations under study in their ideal sample size.
The lines representing P0 were taken at random from fertile plants of the S0 generation of the original population. To represent P1, S0 plants were also taken at random, but from the population resulting from the first recurrent selection cycle for traits such as adaptation to acid soils; resistance to diseases, particularly blast and RHBV; resistance to insect pests, especially Tagosodes orizicolus Muir; good grain quality; and early maturity.
Populations P2 and P3 originated from samples of S0 plants from recombinant populations, using male-sterile plants (Figure 1). The S0:1 seed harvested from 44 S0 plants gave rise to 44 S0:1 lines from each population. For the four populations, a total of 176 lines were planted, together with six checks. Three of the checks were acid-soil tolerant and were derived from the japonica group (Oryzica Sabana 6, Oryzica Sabana 10 and CIRAD 409). Another three, which were susceptible, derived from the indica group (CICA 8, CICA 9 and Oryzica Llanos 5). The checks were replicated three times, whereas the lines, because of the lack of seed (S0:1 seed from only one S0 plant) were used only once. It should be pointed out that the S0:1 lines were considered random samples from each of the four populations, but with the restricted population size, as mentioned above.
Figure 1. Origin of the populations used to compare population improvement strategies for the rice crop.
The distribution of field space at the LLES for both checks and lines was completely at random. The previous scheme was carried out for each environment, or treatment characterizing soil acidity, and which comprised the application of either 300 kg ha-1 or 3000 kg ha-1 of dolomitic lime. Each of the two environments had an area of 627 m2 (19 × 33 m) planted to 182 genotypes in 194 plots (44 lines × 4 populations plus the 6 checks replicated three times). Each plot comprised 2 rows, 5 m long, and spaced at 0.26 m, and was planted at a density of 6 g of seed per plot.
To determine the effect of selection and of the recombination cycles on the populations, the following variables were evaluated:
Reaction to acid soils, as determined in 40 individual plants, marked at random within each material, 48 and 60 days after planting (DAP), using IRRI’s scale of 1 to 5 (1996)
Plant height (PH), for which 10 individual fertile plants were chosen and measured in centimetres from the base of the plant to the extremity of the highest panicle
Number of days to 50% flowering (FLR)
Grain yield (GY) of the entire plot
Number of tillers per square metre (T/M2) in a sample collected along a linear metre.
Postharvest data such as 10-panicle weight (PW10) were obtained from a sample collected along a linear metre. The number of filled grains (FG) and number of empty grains (EG) were determined from a sample of 10 panicles. The 1000-grain weight (GW1000) was also determined.
Because the work developed under two acid-soil environments, the populations were analysed in terms of their reaction to acidity, for which the chi-square independence test was used among the populations. It should be emphasized that, because of their origins, all the populations had the same pattern of tolerance of acidity.
For the remaining traits evaluated, an analysis of combined variance was carried out. When the interaction of populations with environment was significant, analyses were carried out separately for each environment. In significant cases, the separation of means was done through the multiple range test created by Ryan (1959, 1960), Einot and Gabriel (1975), and Welsch (1977), called the REGWQ test in the analytical tables. All these analyses were conducted with the SAS package (1988), version 6.03.
Table 1 presents the statistical model of analysis for each environment. The sources of variation were Category, which was fixed, including the checks and lines; Population, which was also regarded as fixed, taking into account the checks from the japonica and indica groups, and the lines or P0, P1, P2 and P3 populations. The source Lines was regarded as random. Table 2 shows the analytical model combining the two environments.
Table 1. Model for the analysis of variance at each of two levels of dolomitic lime (300 and 3000 kg ha-1) (environments or treatments).
|
Source of variationa |
df |
|
1. Category |
1 |
|
2. Population (category) |
4 |
|
3. Lines [population (category)] |
176 |
|
4. Replication {lines [population (category)]} |
12 |
|
Total |
193 |
a. The error term for testing the hypothesis for items 1 and 2 is item 3; for testing the hypothesis for 3, item 4.
Table 2. Model for the analysis of combined variance at each of two levels of dolomitic lime (300 and 3000 kg ha-1) (environments or treatments).
|
Source of variationa |
df |
|
1 Environment |
1 |
|
2 Category |
1 |
|
3 Population (category) |
4 |
|
4 Lines [population (category)] |
176 |
|
5 Environment × category |
1 |
|
6 Environment × population (category) |
4 |
|
7 Environment × line [population (category)] |
176 |
|
8 Replication {environment × line [population (category)]} |
24 |
|
Total |
387 |
a. The error term for testing the hypothesis for items 2 and 3 is item 4; for testing the hypothesis for 1, 5 and 6, item 7.
To facilitate the presentation of the principal results obtained in this study, the observations initially concentrated on the traits that, in the analyses of variance, did not interact significantly with the environment. These refer to those that presented the source of variation as Environment × population (category) ns where ‘ns’ means not significant (Table 3). For the traits FLR, GY, PW10, FG and EG, a global, multiple comparison of averages (REGWQ test) could be carried out, joining the two environments or treatments. For the other traits (PH, T/M2 and GW1000), this interaction was significant, and the REGWQ test had to be carried out separately for each of the two environments or treatments.
The data obtained during the two periods of evaluation did not present changes in reaction to acidity. Hence, for analysis, only the evaluation carried out at 48 DAP was considered. Although the statistical chi-square test shows that the distribution of materials in the populations presented significant variation, the evaluations fluctuated between the scores 1 and 3 on the scale, indicating tolerance of acidity in all population lines. Hence, these data are neither discussed nor presented here.
Although this work seeks to study the effect of selection and recombinations on the populations derived from PCT-4, for additional information, it is worth discussing the performance of the traits evaluated under the two levels of dolomitic lime (300 and 3000 kg ha-1), because these populations developed under conditions of high acidity and are destined for the savannah ecosystem.
Table 3. Level of significance in the analyses of combined variance at each of two levels of dolomitic lime (300 and 3000 kg ha-1) (environments or treatments).
|
Source of variationa |
Traitb |
|||||||
|
FLR |
GY |
PW 10 |
FG |
EG |
PH |
T/M2 |
GW 1000 |
|
|
1 Environment |
** |
** |
** |
ns |
ns |
** |
ns |
** |
|
2 Category |
** |
** |
** |
ns |
ns |
** |
ns |
** |
|
3 Population (category) |
** |
** |
** |
** |
** |
** |
** |
** |
|
4 Lines [population (category)] |
** |
** |
** |
** |
** |
** |
** |
** |
|
5 Environment × category |
ns |
ns |
ns |
ns |
ns |
ns |
ns |
** |
|
6 Environment × population (category) |
ns |
ns |
ns |
ns |
ns |
** |
** |
* |
|
7 Environment × line [population (category)] |
ns |
ns |
ns |
ns |
ns |
** |
ns |
ns |
|
CV (%) |
2.7 |
15.8 |
15.4 |
15.7 |
11.5 |
4.0 |
16.1 |
3.6 |
a. The error term for testing the hypothesis for items 2 and 3 is item 4; for testing the hypothesis for 1, 5 and 6, item 7.
b. Abbreviations are FLR for number of days to 50% flowering; GY for grain yield; PW10 for 10-panicle weight; FG for number of filled grains; EG for number of empty grains; PH for plant height; T/M2 for number of tillers per square metre; and GW1000 for 1000-grain weight. Statistical symbols **, * and ns indicate, respectively, that values are significant at 1% of probability; at 5% of probability; or not significant.
Source: Adapted from Ospina (2002).
The general performance of the populations that had no significant interaction with the two environments or treatments of acidity shows that the average number of days to flowering (FLR) was smaller (75.3 vs 76.1 days), that is, the population were earlier maturing when 300 kg ha-1 of dolomitic lime was applied. The trait EG was also smaller in this environment (20.9 vs 22.0 EG per panicle). Yield declined with increased dolomitic lime (2673 vs 2457 kg ha-1), and a similar performance was observed for FG (58.9 vs 58.0 filled grains per panicle) and for PW10 (16.7 vs 16.2 g). All these values were statistically different according to the REGWQ test (data not presented).
From these results we can conclude that, regardless of the population from which they derived, all lines presented a high level of tolerance of acidity, because the best results were observed at the lower level of dolomitic lime (Table 4). These data are corroborated by the scores of 1 to 3 obtained in the evaluations for acidity.
Table 4. General performance of the traits evaluated that did not present interaction with two treatments (or environments) of dolomitic lime. That is, the interaction Environment × population (category) was not significant.
| Trait |
Dolomitic limea at kg ha-1 |
|
|
300 |
3000 |
|
|
Number of days to 50% flowering (FLR) |
< |
> |
|
Grain yield (GY) |
> |
< |
|
10-panicle weight (PW10) |
> |
< |
|
Number of filled grains (FG) |
> |
< |
|
Number of empty grains (EG) |
< |
> |
a. The symbol > indicates that the trait scored the highest value; and <, the trait scored the lowest value
The selection carried out on the original population P0, which theoretically produced the best with one recurrent selection cycle (P1), emphasized only some agronomic traits such as reaction to soil acidity, yield, number of days to 50% flowering and plant height. The other traits changed because of the pressure exerted on these first ones, or because of a visual evaluation based on the experience of plant breeders involved in the improvement rather than data.
Number of days to 50% flowering (FLR)
This variable was under selection pressure for identifying the earliest maturing materials, that is, those that reach 50% flowering at about 75 DAP. Generally, national programmes demand this trait so that upland rice can compete with other crops in the same production systems (Kluthcouski et al., 1999; Pinheiro et al., 1999).
In Table 3, in the combined variance analysis, highly significant differences are observed for Environment and for Population (category). In Table 5, which shows data from the analysis using the REGWQ test, the checks from the indica group (poorly adapted to acid soils) present significantly higher averages for FLR than do the other materials. In contrast, the checks from the japonica group (well adapted to acid-soil conditions) are early maturing, although statistically a little later than all four populations developed in this study.
The effect of the selection cycle was statistically significant and in the direction desired, as FLR was reduced from 76.4 days (population P0) to 70.8 days (P1). However, the recombinations following selection permitted the cycle of materials to be prolonged until the progress made with selection disappeared after two recombinations, that is, no significant differences were found between P0 and P3.
Table 5. Averages and their significances (REGWQ test) for the traits number of days to 50% flowering (FLR), grain yield (GY), 10-panicle weight (PW10), number of filled grains (FG) and number of empty grains (EG). Lines from each of four populations and two groups of checks were used.
|
Category, Populationa |
Traitb |
|||||
|
FLR |
GY |
PW10 |
FG |
EG |
||
|
Checks |
|
|
|
|
|
|
| |
J group |
78.5 b |
2380.7 bc |
21.8 a |
79.7 a |
13.6 d |
|
I group |
100.1 a |
1616.9 d |
10.9 c |
43.2 c |
33.8 a |
|
|
Lines |
|
|
|
|
|
|
| |
P0 |
76.4 c |
2520.7 bc |
17.6 b |
60.2 b |
22.5 b |
|
P1 |
70.8 e |
2696.4 ab |
16.3 b |
56.2 b |
22.2 b |
|
|
P2 |
74.3 d |
2952.7 a |
15.8 b |
56.9 b |
17.8 c |
|
|
P3 |
75.8 c |
2312.3 c |
16.2 b |
59.1 b |
22.6 b |
|
a. Abbreviations are ‘J group’ for checks from the japonica group; ‘I group’ for checks from the indica group; P0 for a population with no cycles, that is, the original population; P1 for a population with one recurrent selection cycle; P2 for a population with two recombinations after selection; P3 for a population with three recombinations after selection.
b. Averages followed by the same letters are not significantly different, according to the Ryan-Einot-Gabriel-Welsch multiple range test (REGWQ test) for the separation of means of multiple range.
Source: Adapted from Ospina (2002).
We can therefore conclude that, for population PCT-4, one recurrent selection cycle was effective in reducing the average duration of the materials’ growth cycle. We also conclude that no more than one recombination should be carried out between selection cycles when the objective is to develop populations that concentrate genes for early maturity. It should be emphasized that our results agree with those of Marín-Garavito (1994), but differ from those of Hanson’s theoretical studies (1959) in which he recommends two or three cycles of recombination when creating a population.
Grain yield (GY)
The importance of this variable in rice improvement lies in its being the one that most interests farmers. Moreover, population improvement is being put forward as an alternative for breaking yield ceilings in rice (Rangel and Neves, 1997).
As with the results obtained from the analysis of combined variance for FLR, highly significant differences were detected among Environment and among Population (category) (Table 3). The analysis, using the REGWQ test (Table 5), clearly indicates the poor adaptation of the checks from the indica group to acid soils. Yields were 32% lower than those of the checks from the japonica group and significantly lower than those of all four populations.
Table 6. Effect of one cycle of selection and three recombinations on the upland-rice population PCT-4.
|
Trait |
Populationa |
||
|
One selection cycle (P1) |
Two recombination cycles (P2) |
Three recombination cycles (P3) |
|
|
Number of days to 50% flowering (FLR) |
+ |
- |
- |
|
Grain yield (GY) |
ns |
+ |
- |
|
10-panicle weight (PW10) |
ns |
ns |
ns |
|
Number of filled grains (FG) |
ns |
ns |
ns |
|
Number of empty grains (EG) |
ns |
+ |
ns |
|
Plant height (PH) |
ns |
ns |
+ |
|
Number of tillers per square metre (T/M2) |
ns |
ns |
ns |
|
1000-grain weight (GW1000) |
ns |
ns |
ns |
a. Statistical symbols are ns for no significant effect; + for significant effect in the desired direction; and - for significant effect in the direction contrary to the desired
Conducting only one selection did not introduce significant statistical differences in GY for population P1, although this was almost 7% higher than that for P0. However, carrying out the two recombinations did, unexpectedly and significantly, increase averages for yield. Population P2 had the highest GY (2952.7 kg ha-1) and the two recombinations after selection reduced it to the lowest value (2312.3 kg ha-1). No explanation has been found for these results, except that the small sample size used prevented the populations from being adequately represented, and thus may have influenced the results.
We can conclude that, in contrast to what was observed for FLR, the effect of selection for yield in population PCT-4 was to present a negative effect when moving from two to three recombinations (Table 6). Conducting more than one recombination between recurrent selection cycles is therefore not recommended for accumulating favourable genes for GY. These data also contrast with those of Hanson’s theoretical studies (1959).
10-panicle weight (PW10) and number of filled grains (FG)
The weight and number of filled grains per panicle are components that directly affect GY. As mentioned above, no specific evaluations were conducted for these traits, nor was selection made for them. Instead, selection was indirect, by searching for materials with higher GY. This study, however, tried to quantify the indirect effect that such selection produced on PW10 and FG.
Table 7. Averages by environment, and multiple comparisons of averages of the interaction between environments and populations for the variable plant height (cm).
|
Category, Populationa
|
Dolomitic lime |
||||
|
Environment 1 |
Environment 2 |
||||
|
300 kg ha-1 |
REGWQ testb |
3000 kg ha-1 |
REGWQ testb |
||
|
Checks |
|
|
|
|
|
| |
J group |
88.8 |
ab |
85.2 |
a |
|
I group |
72.0 |
c |
68.9 |
c |
|
|
Lines |
|
|
|
|
|
| |
P0 |
91.8 |
a |
84.9 |
ab |
|
P1 |
85.8 |
ab |
84.3 |
ab |
|
|
P2 |
82.2 |
b |
79.8 |
ab |
|
|
P3 |
81.8 |
b |
78.0 |
b |
|
a. Abbreviations are ‘J group’ for checks from the japonica group; ‘I group’ for checks from the indica group; P0 for a population with no cycles, that is, the original population; P1 for a population with one recurrent selection cycle; P2 for a population with two recombinations after selection; and P3 for a population with three recombinations after selection.
b. Averages followed by the same letters are not significantly different, according to the Ryan-Einot-Gabriel-Welsch multiple range test (REGWQ test) for the separation of means of multiple range.
Source: Adapted from Ospina (2002).
As with FLR and GY, differences for the two traits were highly significant for the source of variation Population (category) in the analysis of combined variance. Following the data for GY, the checks for the indica group had smaller PW10 and FG, and those of the japonica group clustered at the other extreme, being significantly higher than the weights presented by all populations (Table 5). This indicates that a great opportunity exists to improve GY for all populations by increasing PW10 and FG.
The selection cycle and the two and three recombinations did not produce significant effects, whether positive or negative, in the populations (Tables 5 and 6). All values for PW10 and FG observed in the populations were less than the 21.8 g for PW10 and 79.7 FG presented by the checks of the japonica group, and statistically similar to each other. Because selection was not specifically directed at PW10 or FG, these results are to be expected. They also show that, once again for population PCT-4, Hanson’s concepts (1959) do not operate according to theory.
Number of empty grains (EG)
This trait is directly related to FG and was not directly used in selection. The analysis of combined variance indicates differences for the source of variation Population (category) (Table 3). In Table 5, the REGWQ test shows that no differences existed between populations, except for that which had two recombination cycles (P2), but all differed from the two groups of checks.
The two groups of checks were significantly different. As was expected, the indica group had a higher number of empty grains per 10 panicles. The selection and three recombinations had no significant effect on the populations. However, two recombinations (P2) changed the average in the desired direction (Table 6). Again, this effect may be explained by the sample’s small size.
For EG in population PCT-4, we can conclude that one indirect recurrent selection cycle did not reduce the number of empty grains and that conducting more than one recombination between recurrent cycles would not contribute gains to the process (Table 6).
Plant height (PH)
Plant height is one of the easiest traits for visual selection, and is very important in harvesting and in yield as it is directly related to lodging in plants.
The analysis of combined variance indicated that highly significant differences exist for Environment and for the interaction Environment × population (category) (Table 3). This does not allow bringing together the data for the two environments and, as a result, the analyses using the REGWQ test are carried out and presented per environment or treatment (Table 7).
The checks of the indica group are significantly the shortest in each environment. For the two treatments, no significant differences were found among the checks of the japonica group and the four populations, except for P3 in the treatment with 3000 kg ha-1 of dolomitic lime. In the treatment receiving the smaller application of dolomitic lime, two and three recombinations produced shorter plants than those of P0, but were not significantly different from the population that underwent one selection cycle (P1). With 3000 kg ha-1, no differences were observed among the populations.
With these data, we conclude that the selection was not effective in reducing PH, and that neither did the recombinations significantly affect the trait (Table 6). The reason for the significant difference observed between P0 and P2 in the treatment with less dolomitic lime would be that, in this environment, the plants presented higher averages in height in all treatments, especially for P0 (91.8 cm).
Number of tillers per square metre (T/M2)
This trait is of major importance for determining GY but, again, selection was indirect. The analysis of combined variance detected highly significant differences for the interaction Environment × population (category) (Table 3), which is why the data are presented by environment in Table 8.
In contrast to PH, the checks of the indica group have significantly higher values for T/M2 in the two environments. No significant differences were found between the checks of the japonica group and the four populations, except for P3 in the environment with less dolomitic lime. It should be mentioned that the four populations are of japonica origin and that, as a result, a smaller capacity for tillering is expected.
Table 8. Averages by environment, and multiple comparisons of averages for the interaction between environments and populations for the variable tillers per square metre (T/M2).
|
Category, Populationa |
Dolomitic lime |
||||
|
Environment 1 |
Environment 2 |
||||
|
300 kg ha-1 |
REGWQ testb |
3000 kg ha-1 |
REGWQ testb |
||
|
Checks |
|
|
|
|
|
| |
J group |
57.7 |
a |
66.0 |
bc |
|
I group |
77.2 |
b |
83.1 |
a |
|
|
Lines |
|
|
|
|
|
| |
P0 |
64.1 |
ab |
56.4 |
c |
|
P1 |
67.0 |
ab |
70.2 |
b |
|
|
P2 |
67.2 |
ab |
68.2 |
bc |
|
|
P3 |
59.8 |
b |
69.8 |
c |
|
a. Abbreviations are ‘J group’ for checks from the japonica group; ‘I group’ for checks from the indica group; P0 for a population with no cycles, that is, the original population; P1 for a population with one recurrent selection cycle; P2 for a population with two recombinations after selection; and P3 for a population with three recombinations after selection.
b. Averages followed by the same letters are not significantly different, according to the Ryan-Einot-Gabriel-Welsch multiple range test (REGWQ test) for the separation of means of multiple range.
Source: Adapted from Ospina (2002).
With these results, we conclude that, regardless of the environment, one recurrent selection cycle and two and three recombinations did not significantly affect T/M2 in any of the populations derived from PCT-4 (Table 6).
1000-grain weight (GW1000)
This is another important variable determining GY. The analysis of variance detected significant differences for the interaction Environment × population (category) (Table 3), which is why results are presented by environment in Table 9.
The results presented in Table 9 show that no significant differences were found among the populations at either of the two levels of dolomitic lime. Differences were observed when the two groups of checks were compared among themselves and with the four populations. The indica group had the lowest values for GW1000, due to poor grain filling caused by lack of adaptation to the acid soils. Neither did the selection nor the recombinations have an effect on this trait (Table 6). That is, no more than one recombination between recurrent selection cycles would be recommended when the goal is to increase the number of favourable genes for increased GW1000.
Table 9. Averages by environment, and multiple comparisons of the averages of the interaction between environment and population for the variable 1000-grain weight (GW1000).
|
Category Populationa
|
Dolomitic lime |
||||
|
Environment 1 |
Environment 2 |
||||
|
300 kg ha-1 |
REGWQ testb |
3000 kg ha-1 |
REGWQ testb |
||
|
Checks |
|
|
|
|
|
| |
J group |
28.0 |
bc |
27.0 |
bc |
|
I group |
26.3 |
c |
25.0 |
c |
|
|
Lines |
|
|
|
|
|
| |
P0 |
30.5 |
a |
30.1 |
a |
|
P1 |
30.3 |
ab |
29.8 |
a |
|
|
P2 |
29.9 |
ab |
29.4 |
a |
|
|
P3 |
29.1 |
ab |
28.1 |
ab |
|
a. Abbreviations are ‘J group’ for checks from the japonica group; ‘I group’ for checks from the indica group; P0 for a population with no cycles, that is, the original population; P1 for a population with one recurrent selection cycle; P2 for a population with two recombinations after selection; and P3 for a population with three recombinations after selection.
b. Averages followed by the same letters are not significantly different, according to the Ryan-Einot-Gabriel-Welsch multiple range test (REGWQ test) for the separation of means of multiple range.
Source: Adapted from Ospina (2002).
Table 6 summarizes the effects of one selection cycle and three recombinations on the upland-rice population PCT-4. The results produced in this study showed that the traits GY, PW10, FG, EG, PH, T/M2 and GW1000 did not change their performance after one recurrent selection cycle. Except for GY and PH, the outcomes for the other traits were as expected, as they were not under direct selection pressure.
For GY and PH, the strategy used did not produce the sought-for effect, suggesting that the selection was not efficient and that adjustments in the methodology should be made.
With respect to the recombinations, effects were variable. For GY and EG, two recombinations produced positive effects, but for FLR the effects were negative. Three recombinations produced negative effects for FLR and GY and positive effects for PH. Because, overall, no clear trend was observed in either the positive or negative direction for the different traits (Table 6), we conclude that, for this population, doing more than one recombination between recurrent selection cycles would not be recommended.
With this information, we suggest that plant breeders who work with recurrent selection carry out, at regular intervals, an evaluation of the progress made for the different traits subjected to selection, because, for some, mistakes may occur by assuming that the methodology is functioning. The evaluation would provide an opportunity to make needed corrections in the course of the strategy’s execution.
References
Châtel, M. & Guimarães, E.P. 1997. Recurrent selection in rice, using a male-sterile gene. Cali, Colombia, CIRAD-CA & CIAT. 70 pp.
Châtel, M.; Guimarães, E.P.; Ospina, Y. & Borrero, J. 1997. Utilización de acervos genéticos y poblaciones de arroz de secano que segregan para un gen de androesterilidad. In E.P. Guimarães, ed. Selección recurrente en arroz, pp. 125-138. Cali, Colombia, CIAT.
Eniot, I. & Gabriel, L.R. 1975. A study of the powers of several methods of multiple comparisons. J. Am. Statist. Assoc., 70: 351.
Fehr, W.R. 1987. Principles of cultivar development, Vol. 1: Theory and technique. New York, Macmillan Publishing. 536 pp.
Fujimaki, H. 1979. Recurrent selection by using genetic male sterility for rice improvement. Jpn. Agric. Res. Q, 13(3): 153-156.
Geraldi, I.O. & Souza, C.L. de. 2000. Muestreo genético para programas de mejoramiento poblacional. In E.P. Guimarães, ed. Avances en el mejoramiento poblacional en arroz, pp. 9-20. Santo Antônio de Goiás, Brazil, Embrapa Arroz e Feijão.
Guimarães, E.P.; Châtel, M.; Ospina, Y.; Borrero, J. & Huertas, P.C. 1996. Mejoramiento de arroz para suelos ácidos. In Informe anual 1994B-1995A. Cali, Colombia, CIAT. 181 pp.
Hanson, W.D. 1959. The breakup of initial linkage blocks under selection mating systems. Genetics, 44: 857-868.
Hull, F.H. 1945. Recurrent selection for specific combining ability in corn. J. Am. Soc. Agron., 37(2): 134-145.
IRRI (International Rice Research Institute). 1996. Standard evaluation system for rice. 4th ed. Los Baños, Philippines. 52 pp.
Kluthcouski, J.; Oliveira, I.P. de; Yokohama, L.P.; Dutra, L.G.; Portes, T. de A.; Silva, A.E. da; Pinheiro, B. da S.; Ferreira, E.; Castro, E. da M. de; Guimarães, C.M.; Gomide, J. de C. & Balbino, L.C. 1999. Sistema barreirão: Recuperación/renovación de pasturas degradadas utilizando cultivos anuales. In E.P. Guimarães; J.I. Sanz; I.M. Rao; M.C. Amézquita & E. Amézquita, eds. Sistemas agropastoriles en sabanas tropicales de América Latina, pp.195-231. Cali, Colombia, CIAT & EMBRAPA.
Marín-Garavito, J.M. 1994. Efecto de número de ciclos de recombinación en la variabilidad de las poblaciones de arroz (Oryza sativa L.). Palmira, Facultad de Ciencias Agropecuarias, Universidad Nacional de Colombia. 50 pp. (BSc thesis)
Ospina, Y. 2002. Respuesta a la selección y a ciclos de recombinación en la población de arroz (Oryza sativa L.) de secano PCT-4. Palmira, Facultad de Ciencias Agropecuarias, Universidad Nacional de Colombia. 76 pp. (MSc thesis)
Pinheiro, B. da S.; Konrad, M.L. & Carmo, M.P. do. 1999. Características morfológicas y fisiológicas relacionadas con el desempeño de arroz de secano asociado con Brachiaria brizantha. In E.P. Guimarães; J.I. Sanz; I.M. Rao; M.C. Amézquita & E. Amézquita, eds. Sistemas agropastoriles en sabanas tropicales de América Latina, pp. 163-174. Cali, Colombia, CIAT & EMBRAPA.
Rangel, P.H.N. & Neves, P.C.F. 1997. Selección recurrente aplicada al arroz de riego en Brasil. In E.P. Guimarães, ed. Selección recurrente en arroz, pp. 79-97. Cali, Colombia, CIAT.
Ryan, T.A. 1959. Multiple comparisons in psychological research. Psychol. Bull., 56: 26-54.
Ryan, T.A. 1960. Significance test for multiple comparison of proportions, variances, and other statistics. Psychol. Bull., 57: 318-328.
SAS Institute Inc. 1988. SAS/STAT user’s guide, version 6.03. Cary, NC, USA. 1028 pp.
Singh, R.J. & Ikehashi, H.I. 1981. Monogenic male sterility in rice: induction, identification and inheritance. Crop Sci., 21(2): 286-289.
Welsch, R.E. 1977. Stepwise multiple comparison procedures. J. Am. Statist. Assoc., 72: 359.
| [30] Rice Project, CIAT,
A.A. 6713, Cali, Colombia. E-mail: [email protected] [31] Embrapa Arroz e Feijão, currently at FAO, Viale delle Termi di Caracalla, 00100 Rome. E-mail: [email protected] [32] CIRAD/CIAT Rice Project, CIRAD-CA, A.A. 6713, Cali, Colombia. E-mail: [email protected] |
![]()
![]()
![]()