![]()
![]()
![]()
The Egyptian economy has traditionally relied heavily on the agricultural sector for food, fibre and other products. The agricultural sector provides the livelihood for about 55 percent of the inhabitants and accounts for almost 34 percent of the total employment and labour force. Agriculture contributes nearly 20 percent of the gross domestic product (GDP) and about 20 percent of the total exports and foreign exchange earnings.
The population of Egypt is estimated at 70 million people occupying only about five percent of the national territory. The population density varies among the governorates. Approximately 17 percent of the Egyptian population lives in Upper Egypt. The rest is distributed between Lower and Middle Egypt. Egypt is an arid to semi-arid region and can be divided into five main physiographic units, the Western Desert, Nile Valley, Nile Delta, Eastern Desert and the Sinai Peninsula.
Egypt has an area of about one million square kilometres or 238 million feddans (one feddan = 0.42 ha). The total agricultural land in Egypt amounts to nearly 8.4 million feddans (3.5 million ha) and accounts for around 3.5 percent of the total area.
One million ha in the irrigated areas suffer from salinization problems, water logging and sodicity. The majority of salt-affected soils are located in the northern-central part of the Nile Delta and on its eastern and western sides. Increased attention is being given to the improvement of salt-affected soils, since they are potentially productive and require less investment, effort, and time for restoring their productivity, than the reclamation of new land.
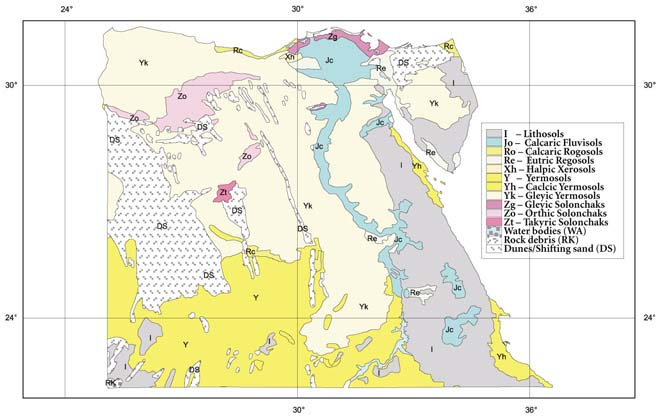
Based on the World Reference Base for Soil Resources, the main Egyptian soil groups are: Arenosols (AR), Calcisols (CL) associated with Gypsisols (GY), Calcisols (CL), Fluvisols (FL), Leptosols (LP), Regosols (RG), Solonchaks (SC) and Vertisols (VR) - see Table 1 and Figure 1.
TABLE 1
Major soil groups and land cover in
Egypt
|
Soil groups/land cover |
Percentage of total |
|
Arenosols (AR) |
25.80 |
|
Calcisols (CL), associated with Gypsisols (GY) |
0.37 |
|
Calcisols (CL) |
9.12 |
|
Fluvisols (FL) |
0.80 |
|
Leptosols (LP) |
24.87 |
|
Water Bodies |
15.44 |
|
Regosols (RG) |
8.68 |
|
Solonchaks (SC) |
0.48 |
|
Vertisols (VR) |
4.85 |
|
Soils outside the area surveyed |
9.59 |
Source: FAO, 1998.
|
FIGURE 1
|
Original scale: 1:5 million
Source:
DSMW-FAO-UNESCO.
Most cultivated soils in Egypt are clayey to loamy in texture. About 420 thousand ha are sandy and calcareous. The average results of physical and chemical analyses of soils, sampled at various locations to represent the various types of soils, are presented in Table 2. The results obtained indicate a wide range of physical and chemical characteristics. The organic matter content is low and so, accordingly, is the concentration of total nitrogen.
As regards the alluvial soils (clayey and loamy clay), available phosphorous determined by Olsen’s method is generally moderate. The results indicate that available (soluble and exchangeable) potassium extracted with a neutral solution of ammonium acetate is high, and this is characteristic of most Egyptian alluvial soils. Micronutrients are above the critical limits, as determined by the DTPA method. Levels of available phosphorus, potassium and micronutrients are fairly low on calcareous and sandy soils.
TABLE 2
Physical and chemical analysis of various soil
types
|
Item |
North Delta |
South Delta |
Middle & |
East Delta |
West Delta |
|
Soil texture |
Clayey |
Clayey |
Loamy clay |
Sandy |
Calcareous |
|
pH (1:2.5) |
7.9-8.5 |
7.8-8.2 |
7.7-8.0 |
7.6-7.9 |
7.7-8.1 |
|
Percent total soluble salts |
0.2-0.5 |
0.2-0.4 |
0.1-0.5 |
0.1-0.6 |
0.2-0.6 |
|
Percent calcium carbonate |
2.6-4.4 |
2.0-3.1 |
2.6-5.3 |
1.0-5.1 |
11.0-30.0 |
|
Percent organic matter |
1.9-2.6 |
1.8-2.8 |
1.5-2.7 |
0.35-0.8 |
0.7-1.5 |
|
Total soluble N (ppm) |
25-50 |
30-60 |
15-40 |
10-20 |
10-30 |
|
ppm available P (Olsen) |
5.4 -10 |
3.5-15.0 |
2.5-16 |
2-5.0 |
1.5-10.5 |
|
ppm available K (amm. acetate) |
250-500 |
300-550 |
280-700 |
105-350 |
100-300 |
|
Available Zn (DTPA) (ppm) |
0.5-4.0 |
0.6-6.0 |
0.5-3.9 |
0.6-1.2 |
0.5-1.2 |
|
Available Fe (DTPA) (ppm) |
20.8-63.4 |
19.0-27.4 |
12.4-40.8 |
6.7-16.4 |
12-18 |
|
Available Mn (DTPA) (ppm) |
13.1-45 |
11.2-37.2 |
8.2-51.6 |
3-16.7 |
10-20 |
Source: Taha, 2000.
Unsatisfactory management of the land is the main limiting factor to agricultural productivity. The following land and water management practices are necessary in order to extract the optimum benefits from using fertilizers:
Control of salinity, water logging and deterioration of soil structure.
Prevention and control of soil degradation.
Proper use of reclaimable land, based on land capability.
Concentration of intensification efforts on the best land.
Recycling of organic matter for use as fertilizer.
Identification of areas where soil regeneration should be given high priority.
The construction of open drainage systems and the installation of shallow tile drains.
Promotion of land leveling to increase water use efficiency in transition and fresh water zones.
Development of land use plans for reclaimable areas.
Use of reclaimable land in sweet water areas to grow ecologically appropriate crops.
Promotion of the most efficient crop husbandry practices.
Integrated crop and livestock systems.
![]()
![]()
![]()