![]()
![]()
![]()
The dominant fertilizers produced and used in Indonesia are urea, TSP (triple superphosphate, 46 percent P2O5), AS (ammonium sulphate, 21 percent N and 24 percent S) and KCl (potassium chloride, 60 percent K2O). More recently Indonesia replaced TSP with SP-36 (superphosphate, 36 percent P2O5) and produced the compound fertilizer Ponska (15 percent N, 15 percent P2O5 and 15 percent K2O).
There are six fertilizer-producing companies in Indonesia. Five of the six companies are government-owned and one is a joint venture with governments of other Asian countries. This joint venture produces urea and ammonia for export. Indonesia owns 60 percent of the shares, Singapore, Malaysia, Philippines and Thailand 40 percent. All six companies produce urea. Only one plant produces also AS, TSP, SP-36, and Ponska. The total production capacity of the six factories is more than 6.5 million tonnes/year (tpy). Between 1998 and 2002, the capacities of all the companies were expanded and reached 7.55 million tpy (Table 9).
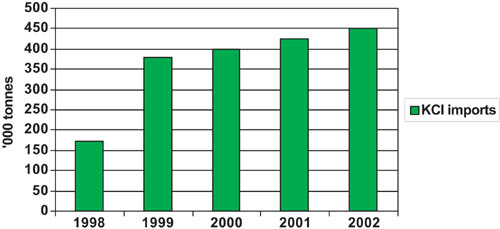
Urea is produced from indigenous raw materials and Indonesia is a net exporter of urea. Indonesia is a net importer of the other fertilizers because of a lack of domestic sources of raw materials for AS, TSP or SP-36. Potassium chloride is imported as a finished fertilizer. The importation of fertilizer and fertilizer materials is handled by state trading companies, which sell the materials to the factories. The imports of potassium chloride are shown in Figure 5.
TABLE 9
Ammonia and fertilizer production
capacities
|
Year |
Production capacity ('000 tonnes) |
||||
| |
Ammonia |
Urea |
TSP/SP-36 |
AS |
NPK |
|
1998 |
4 595 |
6 412 |
1 000 |
650 |
300 |
|
1999-2001 |
4 595 |
6 982 |
1 000 |
650 |
300 |
|
2002 |
4 925 |
7 552 |
1 000 |
650 |
300 |
Source: IFPA, 2004.
|
FIGURE 5
Source: IFPA, 2004. |
Two major urea producers account for 60 to 70 percent of the annual production. However, during the 1998-2000 period, production amounted to only about 6 million tpy or about 90 percent of total production capacity (Table 10). In 2001/02 the utilization of capacity fell to about 80 percent of the total, due to a shortage of gas and damage to one of the plants (IFPA, 2004).
TABLE 10
Indonesian production of nitrogen, phosphorus
and compound fertilizers
|
Product |
Production ('000 tonnes) |
||||
| |
1998 |
1999 |
2000 |
2001 |
2002 |
|
Ammonia |
4 353 |
4 200 |
4 395 |
3 687 |
4 032 |
|
Percent of capacity |
95 |
91 |
96 |
79 |
82 |
|
Urea |
6 156 |
5 971 |
6 333 |
5 333 |
6 006 |
|
Percent of capacity |
96 |
86 |
91 |
76 |
80 |
|
TSP/SP-36 |
643 |
854 |
520 |
654 |
595 |
|
Percent of capacity |
64 |
85 |
52 |
65 |
60 |
|
AS |
284 |
457 |
491 |
448 |
420 |
|
Percent of capacity |
44 |
70 |
76 |
69 |
65 |
|
Ponska |
0 |
0 |
30 |
56 |
66 |
|
Percent of capacity |
|
|
10 |
19 |
22 |
Source: IFPA, 2004.
TABLE 11
Domestic consumption of fertilizers,
agricultural and industrial sectors
|
Year |
Consumption ('000 tonnes) |
|||||
|
Urea |
AS |
TSP/SP-36 |
KCl |
Total |
||
|
Agriculture |
Industry |
|
|
|
|
|
|
1998 |
4 290 |
479 |
408 |
869 |
172 |
6 217 |
|
1999 |
3 140 |
358 |
244 |
395 |
380 |
4 517 |
|
2000 |
3 960 |
366 |
507 |
623 |
400 |
5 856 |
|
2001 |
3 935 |
300 |
511 |
645 |
327 |
5 719 |
|
2002 |
4 273 |
n.a. |
607 |
601 |
450 |
5 931 |
n.a. = not available
Source: IFPA, 2004.
Consumption in the agricultural sector decreased from 4.3 million tonnes in 1998 to 3.1 million tonnes in 1999, but increased again in the following years to reach 4.3 million tonnes again in 2002 (Table 11).
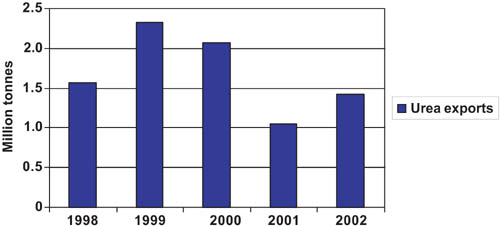
Most of the urea is consumed domestically. The total consumption of urea for the agricultural and industrial sectors is less than the total production, and the surplus urea is exported to a number of countries. During the 1998-2002 period, urea exports fluctuated between 1 and 2.3 million tpy (Figure 6).
In addition to the six state-owned fertilizer producing companies, there are two privately owned ammonia plants. The total exports of ammonia
|
FIGURE 6
Source: IFPA, 2004. averaged 0.85 million tonnes of product per year during the period under consideration. |
Organic materials are very important for maintaining soil fertility in a tropical country such as Indonesia. Livestock wastes, particularly chicken manure and cattle manure, have been applied by farmers for decades, especially in the livestock producing areas. For example, chicken manure has been widely used for maize cultivation in Central Lampung and Sukabumi Districts. In Central Lampung farmers purchase manure from other districts, including Serang, Palembang and South Lampung (Insan Mandiri Konsultan, 2003).
There is no record of the amount of manure produced and used in each province or region. The only available data concern the number of livestock present in each region (Table 12).
Evidently, not all livestock are housed and thus a substantial proportion of the manures is not readily available.
In practice, farmers are not aware of the rates of manure that should be applied and often do not have a rational basis for estimating them. Field-testing is needed to estimate the rates of organic fertilizer that should be recommended to farmers.
There has been considerable progress in understanding the role of organic materials in soil-nutrient availability and the maintenance of soil organic matter. Research institutions have developed models simulating nutrient release patterns according to the quality of the resource and soil and climatic conditions. Implementation of these models would provide a means of making initial recommendations for testing by farmers.
TABLE 12
Distribution of livestock, 2002
|
Island |
Livestock ('000 head) |
||||||
| |
Beef cattle |
Dairy cattle |
Buffalo |
Goat |
Sheep |
Pig |
Horse |
|
Java |
4 269 |
346 |
581 |
7 375 |
7 061 |
164 |
57 |
|
Sumatera |
2 630 |
8 |
1 240 |
3 311 |
499 |
1 438 |
17 |
|
Bali & Nusa |
1 430 |
0 |
300 |
742 |
74 |
2 232 |
165 |
|
Tenggara |
|
|
|
|
|
|
|
|
Kalimantan |
406 |
0 |
69 |
328 |
9 |
821 |
1 |
|
Sulawesi |
1 517 |
0 |
222 |
959 |
9 |
940 |
183 |
|
Maluku & Papua |
184 |
n.a. |
24 |
330 |
9 |
518 |
23 |
|
Indonesia |
10 436 |
354 |
2 436 |
13 045 |
7 661 |
6 113 |
446 |
|
Excluding Java |
6 167 |
8 |
1 855 |
5 670 |
600 |
5 949 |
389 |
Source: CBS, 2002.
Concerning the period under review in this report, between the mid 1990s and the early 2000s there have been a number of decrees regulating fertilizer distribution, some of which were inconsistent with earlier decrees. The efficient supply and distribution of fertilizers were a permanent concern of the government but events limited its capability to act.
The changes since the mid-1990s in the governmental regulations regarding the supply and distribution of fertilizers are illustrated by the following decrees.
1995
Decree No. 182/KP/VIII/95 was issued by the Ministry of Trade, on the Supply and Distribution of Fertilizers for Food Crops. This decree replaced the Ministry of Trade's decree No. 60/KP/IV/1989 on the Supply and Distribution of Subsidized Fertilizer. The fertilizers regulated were urea, TSP/SP-36 and AS. PT Pusri was made responsible for the supply and distribution of urea, while PT Petrokimia Gresik was made responsible for the supply and distribution of TSP/SP-36 and AS, from Line I (the plant gate) down to Line IV (the village). PT Pusri and PT Petrokimia Gresik worked together with fertilizer producers/importers on the supply and distribution of fertilizer.
1996
Decree No. 38/MPP/Kep/3/96 designated PT Pusri as responsible for the supply and distribution of urea, TSP/SP-36 and AS from Line I to Line IV for the Food Crops Sub-Sector. Under this decree, the KUD (Koperasi Unit Desa, village cooperative units) distributors would be appointed by PT Pusri, whereas KUD retailers and private retailers would be selected by KUD distributors with the agreement of PT Pusri.
1997
According to regulation No. 28/1997, a government holding for fertilizer was formed, consisting of PT Pusri, PT Pupuk Iskandar Muda, PT Pupuk Kujang, PT Petrokimia Gresik and PT Pupuk Kaltim. Distribution and marketing activities remained the responsibility of PT Pusri.
1998
Government Statement No. 207/KMK.016/1998 announced that AS and SP-36 for the agricultural sector would no longer be subsidized by the government.
Decree No. 378/MPP/Kep/1998 announced that PT Pusri would be responsible for the supply and distribution of subsidized fertilizer (urea, SP-36, AS and KCl) from Line I to IV. Fertilizer producers had to mark "Subsidized" on the front of fertilizer bags.
In December 1998 the Ministry of Agriculture announced that fertilizer marketing would no longer be regulated and that fertilizer subsidies were removed.
1999
Decree No. 26/MPP/Kep/1999 declared that PT Pusri would be responsible for the supply, distribution and stocks of urea, TSP/SP-36, AS and KCl for food crop farmers in areas that are remote and difficult of access.
2001
According to decree No. 93/MPP/Kep/3/2001 the distribution of urea for food crops and smallholder plantations would be implemented by PT Pusri. This decree also described requirements as regards distributors.
2003
Decree No. 70/MPP/Fep/2/2003 assigned the areas or provinces where respective fertilizer factories would be responsible for supplying fertilizer. Each fertilizer factory is responsible for the distribution of urea to provinces close to their respective plants. Due to the large amounts of urea needed in Java three plants share the distribution of urea in Java. The distribution of the other fertilizers (AS, SP-36 and Ponska) throughout the country is the sole responsibility of PT Petrokimia Gresik. Most of the urea, SP-36 and AS is used on food crops.
Fertilizer use in Indonesia is largely for food, estate (perennial) and horticultural crops. Provision of appropriate types and amounts of fertilizers at the right time, place and affordable prices are very important for the success of agriculture development, especially food security programmes. The largest fertilizer market is urea, followed by SP-36, AS, KCl and Ponska.
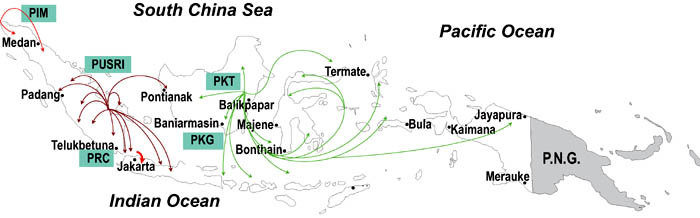
The government organizes fertilizer distribution. Distribution of urea is the responsibility of five state-owned fertilizer plants. Each fertilizer factory is assigned to distribute urea to provinces nearby to the factory site and by considering total amount of urea required by the provinces (Figure 7). Distribution of other fertilizers (AS, SP-36 and Ponska) throughout the country is the sole responsibility of one plant.
The government regulates not only the supply and distribution of fertilizers but also their prices. The government has attempted to fix fertilizer prices at levels affordable by the farmers, in the form of the highest retail price (HRP) at farmers/consumers level, valid for all regions in Indonesia.
|
FIGURE 7
|
The fertilizer pricing policy for sales at the producer level during the "subsidy era" can be divided into three periods (IFPA, 2004):
1. Before 1992: The price paid for fertilizer bought by the government (Government purchasing price, GPP) was calculated on a "cost plus fee" basis. For every tonne produced, the industry received a fee of Rp5 000/tonne.2. 1992-1997: Purchases by the government were based on a border price, whereby the selling prices of urea were standardized for all fertilizer plants and calculated based on an oil price of US$1.00/MMBTU.
3. 1997-December 1998: Following the impact of the monetary crisis in Indonesia, after mid 1997 the calculation of the GPP was based on the foreign currency expenditure needed to purchase the main raw materials, feed stock, plant spare parts and insurance. The GPP was based on a rate of US$1 = Rp6 000. However, in reality the rates moved between Rp10 000 and Rp12 000. Consequently, the Ministry of Finance agreed to subsidize the exchange rate difference.
The period from 1 December 1998 may be described as the "free market era", when subsidies and market regulations were at first abandoned. The fertilizer price was then entirely dependent on the market mechanism and the law of supply and demand (IFPA, 2004). However, decrees issued in 2001 and 2003 again regulated the fertilizer market, as described above.
The development of fertilizer prices is shown in Table 13.
The prices of urea have fluctuated more than those of other fertilizers. This is because the demand for urea by consumers in China, India and Vietnam is very difficult to predict. Besides consuming their own urea production, China and India sometimes export their surplus stock.
TABLE 13
Domestic and international fertilizer
prices
|
Year |
Fertilizer price (US$/tonne) |
|||||
|
Urea |
TSP/SP-36 |
AS |
||||
|
Domestic |
International |
Domestic |
International |
Domestic |
International |
|
|
1990 |
111.1 |
143.8 |
137.6 |
180.6 |
111.1 |
181.4 |
|
1995 |
143.7 |
210.0 |
228.7 |
172.5 |
154.6 |
105.0 |
|
1998 |
58.1 |
111.0 |
87.1 |
177.5 |
65.3 |
69.0 |
|
2000 |
126.6 |
115.5 |
166.9 |
141.0 |
103.6 |
- |
|
2001 |
112.7 |
- |
161.7 |
- |
107.8 |
- |
Source: IFPA, 2004.
The government's policy is to give priority to domestic fertilizer requirements rather than to exports. The government limits the quantities of fertilizer that may be exported by the producers in order to safeguard domestic supply. However, if export prices are attractive and port security is not strict, illegal exports of fertilizer reserved for domestic supply may occur. This jeopardizes the allocation of fertilizer to the country's farmers (IFPA, 2004). Such impacts could be seen from the short supply of fertilizer that have frequently occurred during the peaks of the lowland rice planting seasons between 2002 and 2004.
Information on costs in 2001 was assembled and a partial economic analysis for selected crops was prepared with special emphasis on fertilizer use (Table 14).
Among the food crops, the total costs for lowland rice, which uses the highest amount of mineral fertilizer, ranged between Rp110 000 (15.7 percent of total cost) in Kalimantan and Rp503 000 (31.7 percent of total cost) in Java. The higher proportion of the cost of fertilizer in relation to total cost in Java reflects the more intensive rice cultivation in Java. The second crop that used high fertilizer application rates was maize and the crops that used the least fertilizer were groundnut and cassava.
TABLE 14
Partial economic analysis of fertilizer use on
food crops
|
Commodity |
Yield, value and production cost |
Nutrient application and cost |
||||
|
Yield |
Produce value |
Production cost |
Mineral |
Manure |
||
|
tonnes/ha |
'000 Rp |
Rp/ha |
kg/ha |
'000 Rp |
'000 Rp |
|
|
Rice |
4.2 |
5 111 |
1 317 |
200 |
362 |
4 |
|
Maize |
2.7 |
2 098 |
511 |
174 |
185 |
19.9 |
|
Groundnut |
1.1 |
2 526 |
637 |
64 |
79 |
14.3 |
|
Soybean |
1.2 |
2 741 |
787 |
104 |
127 |
15.3 |
|
Cassava |
12.3 |
2 881 |
509 |
77 |
83 |
28.7 |
|
Sweet potato |
9.7 |
4 091 |
647 |
93 |
93 |
28.4 |
| |
Nutrient cost as a percentage of the value |
Produce value/nutrient cost |
Nutrient cost/production cost |
|||
| |
Total |
Mineral |
Manure |
|||
|
Rice |
25.8 |
7.1 |
0.08 |
14.0 |
0.28 |
|
|
Maize |
24.4 |
8.9 |
0.95 |
10.2 |
0.40 |
|
|
Groundnut |
25.2 |
3.1 |
0.57 |
27.1 |
0.15 |
|
|
Soybean |
28.7 |
4.6 |
0.56 |
19.3 |
0.18 |
|
|
Cassava |
17.7 |
2.9 |
1 |
25.8 |
0.22 |
|
|
Sweet potato |
15.8 |
2.3 |
0.69 |
33.7 |
0.19 |
|
Source: CBS, 2003.
The supply of appropriate types and amounts of fertilizers at the right times, places and at affordable prices are very important for the success of agricultural development. Farmers can buy fertilizer from the KUD in cash or with a loan to be repaid later after harvesting the crop. For smallholder oil-palm growers, payment after harvest can be arranged by deducting the cost of the fertilizer from the value of the oil-palm products, which is usually paid monthly by KUD to the farmers. Farmers can also buy fertilizer directly in cash from private fertilizer dealers or depots. Farmers' associations such as the KUD village cooperative units or other farmers' organizations and plantation companies can obtain fertilizer from the warehouses through agreed purchasing arrangements.
![]()
![]()
![]()