![]()
![]()
![]()
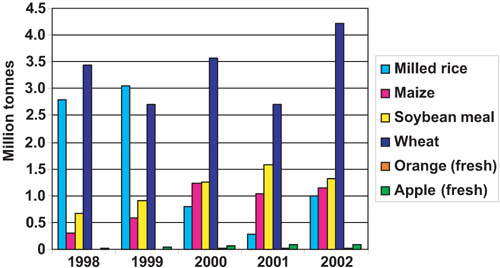
Agriculture has played an important role in buffering Indonesia's economy during the recent, lengthy economic crisis. However, the agricultural sector also experienced considerable difficulties that are reflected in fall in the production of many crops presented in this report. Indonesia has to import considerable amounts of several basic food crops, such as rice, maize, soybean, orange and apple (Figure 8). Although there is no record, sugar (cane sugar) was also imported in large amounts, perhaps about 500 to 700 thousand tonnes or more. All wheat is imported since it cannot be grown in the country.
Grains, pulses and root crops, i.e. the food crops, include rice, maize, groundnut, soybean, cassava and sweet potato and a number of other crops. The main staple food crop in Indonesia is rice, which is produced mainly in irrigated or lowland systems. The other food crops are called palawija or secondary crops because they are usually grown after lowland rice, the first crop in the one-year crop rotation system. Palawija crops are grown also under non-irrigated or rainfed conditions.
| FIGURE 8
Source: MOA, 2003. |
Rice
Rice is grown under intensive cropping with irrigation systems (lowland rice) and rainfed or upland conditions (upland rice). Under dependable irrigation two crops per year are commonly grown by farmers, and occasionally up to five crops can be planted in a 2-year period. Expansion of the lowland rice area in Java is limited due to increasing competition for land with other crops and for non-agricultural uses, such as industry, housing and roads. Agriculture expansion to the outer islands is hindered by the lack of irrigation facilities and swampy, peat or infertile soils.
The production of lowland rice is highly concentrated on Java, followed by Sumatera and Sulawesi (Table 15). The share of harvested area and production of rice in Java from 1998 to 2002 has been nearly constant at around 51 percent. The average yield of brown rice grain was higher on Java (5 tonnes/ha) than in the other regions (4 tonnes/ha), indicating the higher soil fertility or fertilizer use on Java. The total annual harvested area of lowland rice did not change much during the five-year period; it is about 10.5 million ha. Table 16 shows fertilizer use on lowland rice for various provinces.
During the period 1998 to 2002, the harvested area of upland rice fell from 1.3 million ha to 1.1 million ha in 2002 but the average yield remained constant about 2.3 tonnes/ha (Table 17). The area of upland rice was much less and the average yield lower than those of lowland rice. Farmers grow upland rice mainly for subsistence purposes. Many farmers still use old, long growing-period varieties, which have the aroma and taste they prefer. Besides being planted in rotation with food crops such as maize, groundnut and cassava, upland rice is also intercropped with newly replanted rubber trees, especially by smallholders in regions other than Java.
TABLE 15
Lowland rice
| Island | Harvested area ('000 ha) | Average yield (tonnes/ha) | ||||
| | 1998 | 2000 | 2002 | 1998 | 2000 | 2002 |
| Java | 5 380 | 5 390 | 5 263 | 4.99 | 5.13 | 5.25 |
| Sumatera | 2 655 | 2 663 | 2 675 | 4.04 | 4.11 | 4.05 |
| Bali & N. Tenggara | 536 | 559 | 528 | 4.44 | 4.56 | 4.61 |
| Kalimantan | 742 | 841 | 782 | 2.65 | 3.02 | 3.22 |
| Sulawesi | 1 126 | 1 134 | 1 202 | 4.03 | 4.39 | 4.43 |
| Maluku & Papua | 25 | 32 | 23 | 2.81 | 2.92 | 3.10 |
| Indonesia | 10 464 | 10 619 | 10 473 | 4.44 | 4.63 | 4.66 |
| Excluding Java | 5 083 | 5 228 | 5 209 | 3.87 | 4.03 | 4.07 |
TABLE 16
Farmers' practice for fertilizer use at farm level for lowland rice
| Location | Province | Rate of fertilizer (kg/ha) | ||||
| Urea | AS | SP-36 | KCl | NPK (15-15-15) | ||
| Karawang | West Java | 227 | | 150 | 50 | |
| Rangkasbitung | Banten | 250 | | 100 | 50 | |
| Sragen | Central Java | 280 | | 140 | 50 | 70 |
| Solok | West Sumatera | 150 | | 50 | 10 | |
| 50 Kota | West Sumatera | 150 | | 100 | 30 | |
| Soppeng | South Sulawesi | 250 | 85 | 25 | 25 | |
| Polmas | South Sulawesi | 130 | 10 | 10 | 10 | |
| West Lombok | West Nusa Tenggara | 400 | 5 | 110 | | |
| East Lombok | West Nusa Tenggara | 310 | | 50 | 5 | |
Source: Darwis and Numanaf, 2004.
TABLE 17
Upland rice
| Island | Harvested area ('000 ha) | Average yield (tonnes/ha) | ||||
| | 1998 | 2000 | 2002 | 1998 | 2000 | 2002 |
| Java | 372 | 364 | 345 | 2.59 | 2.75 | 2.88 |
| Sumatera | 508 | 393 | 297 | 2.18 | 2.26 | 2.31 |
| Bali & Nusa Tenggara | 103 | 113 | 90 | 1.98 | 2.01 | 2.15 |
| Kalimantan | 207 | 254 | 291 | 1.73 | 1.83 | 2.18 |
| Sulawesi | 49 | 40 | 30 | 1.90 | 2.21 | 2.24 |
| Maluku & Papua | 15 | 12 | 6 | 1.95 | 2.06 | 2.38 |
| Indonesia | 1 253 | 1 176 | 1 059 | 2.20 | 2.29 | 2.44 |
| Excluding Java | 882 | 812 | 714 | 2.03 | 2.08 | 2.23 |
Source: CBS, 1999 - 2002.
Maize
Maize is the second most important crop after rice. The maize area also is concentrated mostly in Java (Table 18). From 1998 to 2002, this island accounted for about 57 percent of harvested area and about 61 percent of the total production. Maize yields in the outer islands were lower (1.56 to 2.95 tonnes/ha) than those in Java (2.76 to 3.37 tonnes/ha). The lower maize yields in the outer islands, also the yields of other palawija crops, is caused by lower soil fertility and rates of fertilizer use. The demand for maize continues to increase, mainly for livestock feed, but from 1998 to 2002 the harvested maize areas decreased from 3 816 to 3 121 thousand ha. Unless there is a substantial increase in the maize area, especially in Java, and a substantial improvement in soil fertility in the outer islands, meeting the maize demand will continue to depend on imports. Table 19 shows fertilizer use on maize for various provinces.
TABLE 18
Maize
| Island | Harvested area ('000 ha) | Average yield (tonnes/ha) | ||||
| | 1998 | 2000 | 2002 | 1998 | 2000 | 2002 |
| Java | 2 218 | 1 957 | 1 736 | 2.76 | 2.96 | 3.37 |
| Sumatera | 739 | 745 | 663 | 2.70 | 2.82 | 2.95 |
| Bali & Nusa Tenggara | 318 | 323 | 307 | 2.10 | 2.13 | 2.78 |
| Kalimantan | 55 | 57 | 49 | 1.56 | 1.61 | 1.97 |
| Sulawesi | 477 | 408 | 356 | 2.54 | 2.45 | 2.55 |
| Maluku & Papua | 10 | 9 | 10 | 1.40 | 1.49 | 1.54 |
| Indonesia | 3 816 | 3 500 | 3 121 | 2.64 | 2.77 | 3.05 |
| Excluding Java | 1 598 | 1 543 | 1 385 | 2.48 | 2.52 | 2.65 |
Source: CBS, 1999 - 2002.
TABLE 19
Farmers' practice for fertilizer use at farm level for maize
| | | Rate of fertilizer (kg/ha) | |||
| Location | Province | Urea | SP-36 | KCl | Manure |
| Kotabumi | Lampung | 250 | 200 | 100 | |
| Bogor | West Java | 300 | 200 | 100 | |
| Sukabumi | West Java | 225 | | | 3 000 |
| Pelaihari | South Kalimantan | 250 | 25 | 60 | 1 300 |
Source: Darwis and Numanaf, 2004.
Cassava
Cassava is the third most important crop after rice and maize. From 1998 to 2002, the harvested area of cassava increased slightly from 1 198 to 1 269 thousand ha (Table 20). The major growing area is Java, accounting for slightly more than half of the harvested area. The average yield in Java is about 13 - 14.5 tonnes/ha, whereas that in other regions is about 11 tonnes/ha. Cassava is mostly not fertilized.
TABLE 20
Cassava
| Island | Harvested area ('000 ha) | Average yield (tonnes/ha) | ||||
| | 1998 | 2000 | 2002 | 1998 | 2000 | 2002 |
| Java | 652 | 670 | 662 | 13.2 | 13.8 | 14.6 |
| Sumatera | 298 | 362 | 389 | 11.4 | 11.4 | 11.7 |
| Bali & Nusa Tenggara | 101 | 106 | 92 | 9.6 | 10.3 | 10.9 |
| Kalimantan | 44 | 42 | 40 | 11.9 | 11.8 | 12.7 |
| Sulawesi | 76 | 73 | 66 | 10.8 | 10.8 | 12.6 |
| Maluku & Papua | 28 | 32 | 18 | 11.2 | 11.1 | 11.8 |
| Indonesia | 1 198 | 1 287 | 1 269 | 12.2 | 12.5 | 13.2 |
| Excluding Java | 545.8 | 616 | 606 | 11.0 | 11.1 | 11.8 |
Source: CBS, 1999 - 2002.
TABLE 21
Groundnut
| Island | Harvested area ('000 ha) | Average yield (tonnes/ha) | ||||
| | 1998 | 2000 | 2002 | 1998 | 2000 | 2002 |
| Java | 423 | 466 | 446 | 1.05 | 1.08 | 1.12 |
| Sumatera | 80 | 67 | 62 | 1.05 | 1.07 | 1.08 |
| Bali & Nusa Tenggara | 48 | 53 | 55 | 1.11 | 1.09 | 1.13 |
| Kalimantan | 24 | 23 | 20 | 1.11 | 1.05 | 1.16 |
| Sulawesi | 65 | 65 | 61 | 1.09 | 1.09 | 1.08 |
| Maluku & Papua | 6 | 1 | 4 | 0.95 | 0.92 | 1.07 |
| Indonesia | 647 | 684 | 648 | 1.06 | 1.08 | 1.11 |
| Excluding Java | 223 | 218 | 203 | 1.08 | 1.07 | 1.10 |
Source: CBS, 1999 - 2002.
Groundnut
Total harvested area of groundnut is relatively small (Table 21). The area remained stable between 1998 and 2002 with relatively low yields of 1.1 tonnes/ha. About 65 to 70 percent of the groundnut area is concentrated on Java. Groundnut is grown after lowland rice and is commonly not fertilized.
Soybean
Soybean, together with groundnut, is an important source of protein in the traditional diet of the Indonesian people. During the period under consideration, the total harvested area of soybean decreased from 1 094 to 546 thousand ha, especially in Java (Table 22). The average yield remained low at about 1.2 tonnes/ha. The major producing area is Java, which from 1998 to 2002 contributed between 61 and 73 percent of the total harvested area. Smallholder farmers are the main growers but as they plant groundnuts after lowland rice, they rely on the residual fertility of the soil.
TABLE 22
Soybean
| Island | Harvested area ('000 ha) | Average yield (tonnes/ha) | ||||
| | 1998 | 2000 | 2002 | 1998 | 2000 | 2002 |
| Java | 669 | 553 | 398 | 1.24 | 1.29 | 1.21 |
| Sumatera | 207 | 120 | 47 | 1.11 | 1.11 | 1.14 |
| Bali & Nusa Tenggara | 138 | 81 | 64 | 1.09 | 1.09 | 1.15 |
| Kalimantan | 16 | 16 | 11 | 1.09 | 1.10 | 1.17 |
| Sulawesi | 55 | 45 | 22 | 1.22 | 1.24 | 1.24 |
| Maluku & Papua | 9 | 9 | 5 | 1.08 | 1.06 | 1.04 |
| Indonesia | 1 094 | 824 | 547 | 1.19 | 1.23 | 1.20 |
| Excluding Java | 425 | 271 | 149 | 1.12 | 1.13 | 1.16 |
Source: CBS, 1999 - 2002.
Sweet potato
The area devoted to sweet potato is relatively small and from 1998 to 2002, the total harvested area decreased from 199 to 171 thousand ha (Table 23). The main growing area is Java, but during the reported period, the harvested area on this island decreased considerably, from 82 to 62 thousand ha and its share of the total harvested area fell from 41 percent to 36 percent. The second largest growing area is Sumatera Island, but the harvested area also decreased there, although yields tended to increase. Sweet potato is commonly not fertilized in Indonesia.
TABLE 23
Sweet potato
| Island | Harvested area ('000 ha) | Average yield (tonnes/ha) | ||||
| | 1998 | 2000 | 2002 | 1998 | 2000 | 2002 |
| Java | 82 | 67 | 62 | 10.8 | 10.9 | 11.5 |
| Sumatera | 45 | 38 | 35 | 8.9 | 9.1 | 9.3 |
| Bali & Nusa Tenggara | 19 | 27 | 19 | 8.9 | 8.7 | 9.3 |
| Kalimantan | 9 | 9 | 10 | 8.0 | 7.8 | 8.2 |
| Sulawesi | 15 | 17 | 17 | 8.2 | 8.2 | 9.1 |
| Maluku & Papua | 28 | 36 | 28 | 8.7 | 8.5 | 11.2 |
| Indonesia | 199 | 194 | 171 | 9.6 | 9.4 | 10.3 |
| Excluding Java | 117 | 127 | 108 | 8.7 | 8.6 | 9.7 |
Source: CBS, 1999 - 2002.
The plantation and industrial crop sector comprises more than twenty crops and occupies an area of more than 15 million ha. These crops play an important role in the Indonesian economy, particularly as regards exports. Among the twenty recognized plantation crops in Indonesia, ten are discussed in this section, i.e. rubber, coconut, oil-palm, sugar cane, coffee, tea, cocoa, tobacco, clove and pepper.
The management systems of plantation and industrial crops may be classified into three categories:
1. Smallholder estates (SHE)
2. Private estates (PE)
3. Government-owned estates (GOE).
The PE and GOE categories in this section are aggregated as large estates (LE).
The SHE generally use low levels of input in their production systems with consequently lower yields than those of LE. In addition, the SHE use traditional processing methods and thus its products have lower quality than those of the PE and GOE.
Rubber
In 1998, the total harvested area of rubber was 3.6 million ha with an average yield of 1.03 tonnes/ha (Table 24). However, by 2002 the area had fallen to 3.3 million ha and the average yield to 0.74 tonnes/ha. The major growing area is Sumatera Island with a harvested area of 2.5 million ha, accounting for about 70 percent of the total harvested area. The average yields in Sumatera were low but constant at about 0.7 tonnes/ha. The second major rubber areas were provinces in Kalimantan Island but there also the average yields were low. The other rubber growing areas were provinces in Java where the average yields were rather higher at about 1 tonne/ha. Rubber is not fertilized.
TABLE 24
Rubber
| Island | Harvested area ('000 ha) | Average yield (tonnes/ha) | ||||
| | 1998 | 2000 | 2002 | 1998 | 2000 | 2002 |
| Java | 142 | 133 | 133 | 1.07 | 0.82 | 0.90 |
| Sumatera | 2 598 | 2 385 | 2 347 | 0.71 | 0.65 | 0.70 |
| Bali & Nusa Tenggara | 0.1 | 0.1 | 0.1 | 1.33 | 0.77 | 0.84 |
| Kalimantan | 892 | 833 | 817 | 0.79 | 0.67 | 0.71 |
| Sulawesi | 14 | 17 | 17 | 1.72 | 0.85 | 0.91 |
| Maluku & Papua | 6 | 5 | 5 | 0.60 | 0.31 | 0.38 |
| Indonesia | 3 653 | 3 373 | 3 318 | 1.04 | 0.68 | 0.74 |
| Excluding Java | 3 511 | 3 240 | 3 185 | 1.03 | 0.65 | 0.71 |
Source: MOA, 2003.
TABLE 25
Management systems for rubber
| System | Unit | 1998 | 2000 | 2002 | Annual percent change |
| Smallholder estates | | | | | |
| Area | '000 ha | 3 082 | 2 883 | 2 829 | -10.8 |
| Yield | tonnes/ha | 0.4 | 0.4 | 0.7 | |
| Production | '000 tonnes | 1 243 | 1 125 | 1 223 | -0.1 |
| Governmental estates | | | | | |
| Area | '000 ha | 230 | 213 | 213 | -1.8 |
| Yield | tonnes/ha | 0.8 | 0.8 | 0.9 | |
| Production | '000 tonnes | 193 | 170 | 189 | -0.2 |
| Private estates | | | | | |
| Area | '000 ha | 341 | 277 | 277 | -4.9 |
| Yield | tonnes/ha | 0.8 | 0.7 | 0.8 | |
| Production | '000 tonnes | 284 | 206 | 219 | -5.8 |
| Total area | '000 ha | 3 653 | 3 372 | 3 318 | |
Source: DG Estate crops, 2000 and 2002.
In 1998, the rubber area under SHE was the largest at 3.08 million ha (84 percent of the total rubber area). However, the area of SHE rubber had decreased to 2.8 million ha by 2002, a fall of 253 thousand ha in five years or a negative growth rate of about 11 percent per annum (Table 25). This reduction in the area was due, at least in part, to a strong trend towards the replacement of rubber by oil-palm.
Oil-palm
During the 1998 to 2002 period, the total harvested area of oil-palm increased from 2.8 million ha in 1998 to 4.1 million ha in 2002, or an increase of 1.3 million ha during the five-year period (Table 26). The expansion of oil-palm took place mainly in Sumatera and Kalimantan Islands. However, during this period the average yield of CPO decreased from 3.32 to 3.08 tonnes/ha.
TABLE 26
Oil-palm
| Island | Harvested area ('000 ha) | Average yield (tonnes CPO/ha) | ||||
| | 1998 | 2000 | 2002 | 1998 | 2000 | 2002 |
| Java | 22 | 21 | 21 | 1.56 | 1.48 | 1.69 |
| Sumatera | 2 140 | 2 744 | 2 865 | 3.08 | 2.78 | 2.84 |
| Bali & Nusa Tenggara | n.a. | n.a. | n.a. | n.a. | n.a. | n.a. |
| Kalimantan | 493 | 844 | 1,057 | 1.99 | 1.94 | 1.82 |
| Sulawesi | 112 | 108 | 116 | 1.99 | 2.04 | 2.15 |
| Maluku & Papua | 23 | 52 | 57 | 4.14 | 3.61 | 3.15 |
| Indonesia | 2 788 | 3 770 | 4 117 | 3.32 | 3.09 | 3.08 |
| Excluding Java | 2 768 | 3 749 | 4 096 | 2.80 | 2.59 | 2.49 |
CPO = Crude palm oil
Source: MOA, 2003.
The increase in the oil-palm area was due mainly to an expansion of oil-palm estates under the PE system, which rose from 2.1 to 3.9 million ha between 1998 and 2002 (Table 27). The second largest increase was in oil-palm estates under the SHE system. However, yields of oil-palm under the SHE and PE systems were low, ranging between 1.4 to 1.8 tonnes/ha of CPO. The yields of GOE estates ranged between 3.5 and 3.7 tonnes/ha of CPO, or almost twice the yields of the SHE and PE estates.
Sugar cane
The total area of sugar cane in 1998 was 377 thousand ha, of which 245 thousand ha (65 percent) were in Java, the second largest area being in Sumatera (30 percent). During the 1998 to 2002 period, the total area of sugar cane fell by 8 percent (Table 28). The national average yield in 1998 was 3.94 tonnes sugar/ha, which increased to 5.45 tonnes sugar/ha in 2002. The recommended fertilizer rates for sugar cane are similar for all sites (Table 29); instead of urea as source of nitrogen, AS is used. Despite the increase in the yield of sugar cane, total sugar production could not meet the national demand. It is estimated that around 500 to 700 thousand tonnes of sugar were imported annually, although more sugar may have entered the country through illegal imports.
TABLE 27
Management systems for oil-palm
| Systems | Unit | 1998 | 2000 | 2002 | Annual percent change |
| Smallholder estates | | | | | |
| Area | '000 ha | 892 | 1 190 | 1 222 | 8.5 |
| Yield | tonnes/ha | 1.4 | 1.7 | 1.8 | |
| Production | '000 ha | 1 246 | 1 978 | 2 227 | 17.0 |
| Governmental estates | | | | | |
| Area | '000 ha | 485 | 529 | 545 | 3.0 |
| Yield | tonnes/ha | 3.5 | 3.7 | 3.7 | |
| Production | '000 tonnes | 1 699 | 1 971 | 2 023 | 4.5 |
| Private estates | | | | | |
| Area | '000 ha | 1 403 | 2 051 | 2 349 | 14.5 |
| Yield | tonnes/ha | 1.5 | 1.8 | 1.7 | |
| Production | '000 tonnes | 2 062 | 3 632 | 3 907 | 18.5 |
| Total area | '000 ha | 2 780 | 3 770 | 4 117 | 9.6 |
TABLE 28
Sugar cane
| Island | Harvested area ('000 ha) | Average yield (tonnes sugar/ha) | ||||
| | 1998 | 2000 | 2002 | 1998 | 2000 | 2002 |
| Java | 245 | 226 | 214 | 3.90 | 4.96 | 4.67 |
| Sumatera | 114 | 119 | 112 | 4.25 | 5.34 | 5.04 |
| Bali & Nusa Tenggara | n.a. | n.a. | n.a. | n.a. | n.a. | n.a. |
| Kalimantan | 6 | 3 | 3 | 1.62 | 1.76 | 1.67 |
| Sulawesi | 12 | 19 | 18 | 3.24 | 4.32 | 2.75 |
| Maluku & Papua | n.a. | n.a. | n.a. | n.a. | n.a. | n.a. |
| Indonesia | 377 | 366 | 347 | 3.94 | 4.96 | 5.45 |
| Excluding Java | 132 | 140 | 133 | 3.04 | 3.81 | 3.15 |
Source: MOA, 2003.
Coffee
The total harvested area of coffee in 1998 was 1.15 million ha and increased to 1.27 million ha in 2002, with average yields of about 0.62 tonnes/ha throughout the period (Table 30). Coffee plantations were located mostly in Sumatera, which in 1998 accounted for 59 percent (0.68 million ha) of the total harvested area. The other major coffee areas were Java, Sulawesi, Bali and Nusa Tenggara Islands. Sumatera had the highest average yield, 0.65 tonnes/ha in 1998, but it decreased to 0.57 tonnes/ha in 2002. The other areas have lower yields particularly Java with average yields of only 0.40 and 0.48 tonnes/ha in 1998 and 2002, respectively. Coffee is mostly grown by smallholders and fertilizer use is not common.
Tea
The total harvested area of tea during the 1998-2002 period was approximately constant, at about 158 thousand ha, with an average yield, also constant, of 1.43 tonnes/ha (Table 31). The primary tea-producing island was Java, which accounted for 84 percent of the total harvested area, with West Java Province as the major producer. The second most important tea-producing island was Sumatera, which in 2002 accounted for 15 percent of the total harvested area. The contribution of the other islands to tea production was negligible. Tea is managed by smallholders and on plantations (about 50 percent of the total area each). A general fertilizer recommendation is 150 kg/ha N, 100 kg/ha P2O5 and 100 kg/ha K2O plus 50 kg/ha MgO.
TABLE 29
Recommended rate of fertilizer for sugar cane at various sugar cane plantations on Java and Sumatera
| Location | Province | Land typology | Crop | Rate of fertilizer (kg/ha) | ||
| PT Nusantara IX plantation | AS | SP-36 | KCl | |||
| Jatibarang | West Java | Lowland | Plant cane | 700 | 200 | 100 |
| | | | Ratoon | 700 | 200 | 0 |
| | West Java | Dry land | Plant cane | 700 | 200 | 0 |
| | | | Ratoon | 700 | 200 | 0 |
| Pangka | Central Java | Lowland | Plant cane | 700 | 200 | 200 |
| | | | Ratoon | 700 | 200 | 200 |
| | | Dry land | Plant cane | 700 | 200 | 200 |
| | | | Ratoon | 700 | 200 | 200 |
| Sumberharjo | Central Java | Lowland | Plant cane | 700 | 200 | 200 |
| | | | Ratoon | 800 | 200 | 200 |
| | | Dry land | Plant cane | 700 | 200 | 200 |
| | | | Ratoon 1 | 700 | 200 | 200 |
| | | | Ratoon 2 | 800 | 200 | 200 |
| Sragi | Central Java | Lowland | Plant cane | 700 | 200 | 200 |
| | | | Ratoon | 700 | 200 | 200 |
| | | Dry land | Plant cane | 700 | 200 | 200 |
| | | | Ratoon 1 | 700 | 200 | 200 |
| | | | Ratoon 2 | 700 | 200 | 200 |
| Rendeng | Central Java | Dry land | Plant cane | 700 | 200 | 100 |
| | | | Ratoon 1 | 700 | 200 | 100 |
| | | | Ratoon 2 | 700 | 200 | 100 |
| Mojo | Central Java | Lowland | Plant cane | 700 | 200 | 200 |
| | | | Ratoon | 700 | 200 | 200 |
| | | Dry land | Plant cane | 700 | 200 | 200 |
| | | | Ratoon | 700 | 200 | 200 |
| Tasikmadu | Central Java | Lowland | Plant cane | 700 | 200 | 200 |
| | | | Ratoon | 700 | 200 | 200 |
| | | Dry land | Plant cane | 600 | 200 | 200 |
| | | | Ratoon 1 | 600 | 200 | 200 |
| | | | Ratoon 2 | 600 | 200 | 200 |
| Gondang Baru | Central Java | Lowland | Plant cane | 600 | 100 | 100 |
| | | | Ratoon | 600 | 100 | 100 |
| | | Dry land | Plant cane | 700 | 100 | 0 |
| | | | Ratoon 1 | 700 | 100 | 100 |
| | | | Ratoon 2 | 700 | 100 | 100 |
| PT Nusantara VII | Rate of fertilizer (kg/ha) | |||||
| | Urea | TSP | KCl | |||
| Bunga Mayang | Lampung | Dry land | Plant cane | 400 | 350 | 300 |
| | | | Ratoon | 500 | 400 | 400 |
| Gunung Madu | Lampung | Dry land | Plant cane | 300 | 200 | 300 |
| | | | Ratoon | 300 | 200 | 300 |
Source: Sri Adiningsih et al., 2003.
TABLE 30
Coffee
| Island | Harvested area ('000 ha) | Average yield (tonnes/ha) | ||||
| | 1998 | 2000 | 2002 | 1998 | 2000 | 2002 |
| Java | 183 | 165 | 166 | 0.40 | 0.48 | 0.48 |
| Sumatera | 681 | 793 | 803 | 0.65 | 0.57 | 0.57 |
| Bali & Nusa Tenggara | 108 | 109 | 109 | 0.52 | 0.53 | 0.54 |
| Kalimantan | 38 | 39 | 39 | 0.47 | 0.47 | 0.47 |
| Sulawesi | 131 | 136 | 134 | 0.63 | 0.51 | 0.63 |
| Maluku & Papua | 13 | 15 | 18 | 0.41 | 0.38 | 0.36 |
| Indonesia | 1 153 | 1 258 | 1 269 | 0.61 | 0.63 | 0.62 |
| Excluding Java | 970 | 1 093 | 1 103 | 0.53 | 0.49 | 0.51 |
Source: MOA, 2003.
TABLE 31
Tea
| Island | Harvested area ('000 ha) | Average yield (tonnes/ha) | ||||
| | 1998 | 2000 | 2002 | 1998 | 2000 | 2002 |
| Java | 133 | 129 | 133 | 1.16 | 1.03 | 1.05 |
| Sumatera | 25 | 22 | 24 | 1.44 | 1.36 | 1.71 |
| Bali & Nusa Tenggara | n.a. | n.a. | n.a. | n.a. | n.a. | n.a. |
| Kalimantan | n.a. | n.a. | n.a. | n.a. | n.a. | n.a. |
| Sulawesi | 0.1 | 2 | 2 | 1.28 | 0.16 | 0.72 |
| Maluku & Papua | n.a. | n.a. | n.a. | n.a. | n.a. | n.a. |
| Indonesia | 158 | 153 | 159 | 1.43 | 1.39 | 1.43 |
| Excluding Java | 25 | 24 | 26 | 1.44 | 1.27 | 1.22 |
Source: MOA, 2003.
Cocoa
The total harvested area of cocoa during the 1998 to 2002 period increased rapidly from 578 to 777 thousand ha (Table 32). The increase took place mostly in Sulawesi (from 289 to 423 thousand ha) and Sumatera (from 107 to 143 thousand ha). The national average yield was 1.19 tonnes/ha in 1998 but it fell to 0.90 tonnes/ha in 2002. The relatively low yields were due partly to inappropriate fertilization practices. Cocoa is mostly grown by smallholders and fertilizer use is not common.
TABLE 32
Cocoa
| Island | Harvested area ('000 ha) | Average yield (tonnes/ha) | ||||
| | 1998 | 2000 | 2002 | 1998 | 2000 | 2002 |
| Java | 50 | 56 | 57 | 0.50 | 0.42 | 0.43 |
| Sumatera | 107 | 137 | 143 | 0.71 | 0.54 | 0.54 |
| Bali & Nusa Tenggara | 22 | 42 | 45 | 0.72 | 0.56 | 0.57 |
| Kalimantan | 46 | 45 | 47 | 0.44 | 0.46 | 0.50 |
| Sulawesi | 289 | 410 | 423 | 1.15 | 0.86 | 0.93 |
| Maluku & Papua | 64 | 60 | 63 | 0.77 | 0.57 | 0.60 |
| Indonesia | 578 | 750 | 777 | 1.19 | 0.89 | 0.90 |
| Excluding Java | 528 | 694 | 720 | 0.76 | 0.60 | 0.63 |
Source: MOA, 2003.
Coconut
Coconut is grown throughout the country (except in Jakarta province), with a total area of 3.5 million ha (Table 33). The average yields were 0.75 tonnes copra/ha in 1998 and 0.87 tonnes copra/ha in 2002. The major coconut producing islands are Sumatera, Java and Sulawesi, accounting for about 76 percent of the total harvested area. Coconut is mainly managed by smallholders and fertilizer applications are not common. A medium fertilizer application rate is 100 kg/ha N, 50 kg/ha P2O5 and 100 kg/ha K2O.
Tobacco
The total harvested area of tobacco was 222 thousand ha in 1998 and 257 thousand ha in 2002 (Table 34). The average yield increased from 0.66 tonnes/ha in 1998 to 0.87 tonnes/ha in 2002. Tobacco was grown primarily in Java (East, Central and West Java Provinces), Bali and Nusa Tenggara and Sumatera (North Sumatera Province). Tobacco is grown by both smallholders and on plantations. General fertilizer application is 100 - 150 kg/ha AS, 100 - 150 kg/ha TSP and 100 - 150 kg/ha K2SO4.
TABLE 33
Coconut
| Island | Harvested area ('000 ha) | Average yield (tonnes/ha) | ||||
| | 1998 | 2000 | 2002 | 1998 | 2000 | 2002 |
| Java | 874 | 876 | 876 | 0.67 | 0.74 | 0.78 |
| Sumatera | 1 173 | 1 121 | 1 121 | 0.73 | 0.92 | 0.97 |
| Bali & Nusa Tenggara | 299 | 302 | 302 | 0.56 | 0.60 | 0.63 |
| Kalimantan | 247 | 254 | 254 | 0.61 | 0.64 | 0.67 |
| Sulawesi | 635 | 659 | 663 | 0.98 | 0.97 | 1.01 |
| Maluku & Papua | 277 | 269 | 269 | 0.85 | 0.85 | 0.90 |
| Indonesia | 3 505 | 3 480 | 3 486 | 0.75 | 0.83 | 0.87 |
| Excluding Java | 2 631 | 2 604 | 2 610 | 0.77 | 0.86 | 0.90 |
Source: MOA, 2003.
TABLE 34
Tobacco
| Island | Harvested area ('000 ha) | Average yield (tonnes/ha) | ||||
| | 1998 | 2000 | 2002 | 1998 | 2000 | 2002 |
| Java | 141 | 201 | 225 | 0.52 | 0.71 | 0.73 |
| Sumatera | 5 | 5 | 5 | 0.48 | 0.63 | 0.63 |
| Bali & Nusa Tenggara | 19 | 32 | 26 | 0.77 | 1.23 | 1.20 |
| Kalimantan | n.a. | n.a. | n.a. | n.a. | n.a. | n.a. |
| Sulawesi | 0.5 | 1 | 1 | 0.83 | 0.65 | 0.68 |
| Maluku & Papua | n.a. | n.a. | n.a. | n.a. | n.a. | n.a. |
| Indonesia | 222 | 169 | 257 | 0.66 | 0.76 | 0.87 |
| Excluding Java | 24 | 39 | 32 | 0.69 | 0.83 | 0.84 |
Source: MOA, 2003.
Cloves
The total harvested area of cloves amounted to 429 thousand ha in 1998, decreasing slightly to 417 thousand ha in 2002 (Table 35). Cloves are grown throughout the country. The major producing islands are Sulawesi, Java and Sumatera. Clove yields commonly fluctuate with a high yield in one year out of four. The average yield increased substantially between 1998 and 2002.
TABLE 35
Cloves
| Island | Harvested area ('000 ha) | Average yield (tonnes/ha) | ||||
| | 1998 | 2000 | 2002 | 1998 | 2000 | 2002 |
| Java | 140 | 134 | 134 | 0.17 | 0.17 | 0.21 |
| Sumatera | 66 | 59 | 58 | 0.14 | 0.08 | 0.09 |
| Bali & Nusa Tenggara | 37 | 34 | 33 | 0.28 | 0.17 | 0.26 |
| Kalimantan | 4 | 3 | 3 | 0.08 | 0.05 | 0.07 |
| Sulawesi | 145 | 148 | 149 | 0.26 | 0.15 | 0.15 |
| Maluku & Papua | 37 | 39 | 39 | 0.12 | 0.12 | 0.13 |
| Indonesia | 429 | 418 | 417 | 0.20 | 0.28 | 0.30 |
| Excluding Java | 289 | 284 | 282 | 0.18 | 0.13 | 0.15 |
Source: MOA, 2003.
TABLE 36
Pepper
| Island | Harvested area ('000 ha) | Average yield (tonnes/ha) | ||||
| | 1998 | 2000 | 2002 | 1998 | 2000 | 2002 |
| Java | 2 | 3 | 3 | 0.36 | 0.52 | 0.51 |
| Sumatera | 97 | 112 | 113 | 0.55 | 0.59 | 0.58 |
| Bali & Nusa Tenggara | 0.2 | 0.3 | 0.3 | 0.32 | 0.41 | 0.50 |
| Kalimantan | 18 | 20 | 20 | 0.84 | 0.88 | 0.85 |
| Sulawesi | 14 | 15 | 24 | 0.54 | 0.71 | 0.68 |
| Maluku & Papua | 0.1 | 0.1 | 0.1 | 0.35 | 0.32 | 0.38 |
| Indonesia | 131 | 150 | 161 | 0.81 | 0.80 | 0.76 |
| Excluding Java | 129 | 147 | 158 | 0.52 | 0.58 | 0.60 |
Source: MOA, 2003.
Pepper
Pepper is produced in the South Sumatera and Lampung provinces of Sumatera. During the 1998 to 2002 period, the total harvested area increased from 131 to 161 thousand ha, of which South Sumatera and Lampung accounted for about 70 percent (92 thousand ha) in 1998, the proportion decreasing slightly to 67 percent (108 thousand ha) in 2002 (Table 36). It should be noted that since 2000 the South Sumatera province has been divided into two provinces, South Sumatera and Bangka Belitung. Most of the pepper plantations were in Bangka Belitung and not in South Sumatera. Table 37 shows fertilizer recommendation rates for pepper. Pepper is grown by SHE and on plantations.
Fertilizer use on total vegetable and fruit crop amounts to about 5 percent and 4 percent respectively of total fertilizer use in Indonesia (FAO et al., 2002). The tables for the vegetable and fruit crops considered are given in Annex 1 and Annex 2 respectively. There are no fertilizer recommendations for vegetable crops, although the use of fertilizers for these crops is very high (intensive). An approximation is 100 - 150 kg/ha N, 100 - 150 kg/ha P2O5 and 100 - 200 kg/ha K2O, lime (1 tonne/ha) might be needed on acid soils.
TABLE 37
Fertilizer recommendations for pepper
| Plant age | Nutrient composition | Rate of fertilizer |
| 1 | 12: 12: 17: 2 | 4 × (20 - 25) |
| 2 | 12: 12: 17: 2 | 4 × (50 - 100) |
| 3 | 12: 12: 17: 2 | 4 × (200 - 400) |
Source: Hanson et al., 1994.
Potato
The harvested area of potato during the 1998 to 2002 period decreased significantly, by about 15 percent, from 65 to 55 thousand ha. This decrease was due to a considerable reduction in the harvested area in the major producing island of Java, from 40 to 35 thousand ha, combined with a substantial decrease from 21 to 16 thousand ha in the second largest producing island of Sumatera. The third largest potato-producing island is Sulawesi. However, the average yield in Sulawesi, at about 9 tonnes/ha in 1998 falling to 6 tonnes/ha in 2002, was much lower than those in Java and Sumatera, where yields reached about 17 tonnes/ha.
Cabbage
The harvested area of cabbage during the 1998 to 2002 period decreased substantially, falling from 69 to 58 thousand ha. This decrease occurred mainly in the two major cabbage producing regions of Java and Sumatera Islands. The harvested area in the third largest cabbage producing region, Sulawesi Island, fell only slightly but the yield was low at about 12 tonnes/ha in 1998, falling to 7.4 tonnes/ha in 2002. Bali and Nusa Tenggara Islands had the highest cabbage yields in the country. Although these islands had a small harvested area of less than two thousand ha, the yield was more than 30 tonnes/ha.
Tomato
The major tomato producing regions are Java, Sumatera and Sulawesi, in the provinces of North Sumatera, Bengkulu, West Sumatera, West Java, North Sulawesi and South Sulawesi. The total harvested area of tomato decreased from 47 in 1998 to 43 thousand ha in 2001 but increased again to 49 thousand ha in 2002. The average yield remained constant at about 11.5 tonnes/ha. The production areas of tomato were highly concentrated in West Java and North Sumatera.
Carrot
During the period in question, the total harvested area of carrot remained stable at about 20 thousand ha. The major producing area was Java with a harvested area of 13 thousand ha or 65 percent of the national harvested area. The second major carrot producing area was Sumatera Island, particularly in North Sumatera and Bengkulu Provinces. However, yields of carrot vary between the islands, ranging from about 18 tonnes/ha in Java to between 12 and 13 tonnes/ha in Sumatera and the other islands.
Spring onion
The total harvested area of spring onion during the 1998 to 2002 period decreased slightly from 36.5 to 34.1 thousand ha, but the average yield remained at about 8 tonnes/ha. The major producing areas were Java Island, particularly East Java, and Sumatera Island, particularly North Sumatera and Bengkulu Provinces. The highest yield was obtained in Java at about 9 tonnes/ha, whereas in Sumatera it was lower, ranging between 5 and 6 tonnes/ha.
Chili
Chili is grown throughout the country. The major growing areas are all the provinces of Java, with a total harvested area that remained constant at about 83 thousand ha during the 1998-2002 period. However, the average yield in these areas decreased from 6.2 to 4.6 tonnes/ha. The second major producing island was Sumatera, particularly in North Sumatera, West Sumatera, N. A. Darussalam and Bengkulu Provinces, but the total harvested area in Sumatera decreased considerably between 1998 to 2002, falling from 56 to 42 thousand ha, and the average yields at about 3 tonnes/ha was lower than those obtained in Java. Table 38 provides fertilizer use for various provinces for red chili.
TABLE 38
Farmers' practice of fertilizer use for red chili at farm level
| | Rate of fertilizer (kg/ha) | ||||||
| Location | Province | Urea | AS | SP-36 | KCl | NPK | Manure |
| Garut | West Java | 620 | 295 | 410 | 160 | 40 | 5 200 |
| Magelang | Central Java | | 380 | 355 | 250 | 180 | 8 500 |
| Gresik | East Java | 300 | 100 | 160 | 85 | 80 | 970 |
Source: Rahmanto, 2001.
Shallot
During the 1998-2002 period, the total harvested area of shallot increased from 76 to 88 thousand ha. Major provinces producing shallot were North Sumatera, West, Central and East Java, West Nusa Tenggara and South Sulawesi. However, the average yield in South Sulawesi was very low (about 3 tonnes/ha), whereas in other provinces yields were about 8 to 9 tonnes/ha.
Mustard green
The total harvested area of mustard green decreased substantially, from 52 to 35 thousand ha during the 1998 to 2002 period, although the average yield remained at about 9 tonnes/ha. The major producing islands were Java and Sumatera, which accounted for about 80 percent of the total harvested area. Average yields of mustard green in Java, Sumatera, Bali and Nusa Tenggara were about 10 tonnes/ha, but the average yield in other islands was considerably lower, at 3 to 5 tonnes/ha.
Numerous fruit crops are produced in Indonesia. In this report, only those fruits that have an important economic status nationally are discussed. Generally fruit crops such as mango, rambutan, durian and avocado are not grown as plantation crops on large areas, but are produced from one to five trees grown in the yards of farm houses. Other fruit crops such as banana and pineapple are planted in larger numbers in the border areas of farms. Most fruits are grown by SHE but recently there has been a tendency for fruit crops such as banana, orange, papaya, pineapple and salacia to be grown as commercial enterprises. Common fertilizer applications are 100 - 150 kg/ha of N, 100 - 150 kg/ha of P2O5 and 100 - 200 kg/ha of K2O. Mg and S might be needed for specific sites and crops.
Banana
Many varieties of banana are grown in different areas, depending on the agro-ecological conditions and consumers' preferences. Banana produces fruits all the year round. Between 1998 and 2001, total banana production in Indonesia increased from 3.2 to 4.4 million tonnes. This increase was due mostly to higher average yields per hectare, which rose from 44.4 to 58.7 tonnes/ha. Java is the largest banana producing area with about a 65 to 70 percent share of the national market. The major areas of production are West Java, East Java and Central Java provinces. Other major producing provinces are North Sumatera, West Sumatera, South Sumatera, Lampung and West Nusa Tenggara.
Orange
Unlike most of the other crops, the major orange production area is not Java but Sumatera Island, followed by Java, Bali and Nusa Tenggara and Sulawesi Islands. During the 1998 to 2002 period orange production increased from 491 to 691 thousand tonnes, but fell back slightly to 664 thousand tonnes in 2002. This increase was due mostly to a higher harvested area, which rose from 23.7 to 47.3 thousand ha. Sumatera had the largest market share, contributing about 36 to 53 percent of total orange production, while Java accounted for 18 to 22 percent. The major provinces for orange production are North Sumatera, Bali, East Java, West Sumatera, West Java and Central Java. During the past five years, the orange area has increased considerably in Central Java (from 0.5 to 1.5 thousand ha) and North Sumatera (from 5.5 to 10.4 thousand ha). However, a large proportion of these changes took place on lowland rice areas, which are among the most productive land areas in the country. This change in land use has some negative impact on national food (rice) security but it has improved farmers' incomes.
Papaya
Papaya is planted throughout the country and is produced all the year round. During the 1998 to 2002 period, except in 2000, national production remained relatively constant at about 500 thousand tonnes per annum. The total harvested area increased from 9.8 to 10.4 thousand ha and the average yield rose from 50 to 59 tonnes/ha. Java had about six thousand ha of papaya, a 75 percent of market share, which decreased to 66 percent in 2002. Other major producing islands were Sumatera and Bali and Nusa Tenggara, which together accounted for 18 to 26 percent of total papaya production. The major papaya production provinces were East Java, Central Java, West Java and East Nusa Tenggara. In 1998, East Java produced 262 thousand tonnes papaya; accounting for 54 percent of national production but in 2002 it produced only 181 thousand tonnes (37 percent). However, papaya production in West Java increased from 44 to 71 thousand tonnes and in East Nusa Tenggara from 21 to 51 thousand tonnes.
Pineapple
Pineapple production increased from 327 to 463 thousand tonnes during the 1998-2002 period. The increase was the result of higher harvested areas (from five to nine thousand ha) and in average yields (from 67 to 75 tonnes/ha). Production on Java during this period declined slightly from 167 to 146 thousand tonnes. Pineapple production in Sumatera increased more than two-fold, from 144 to 301 thousand tonnes. Initially North Sumatera was the major pineapple province in Sumatera but a major increase of pineapple production has occurred in South Sumatera, Riau and Lampung Provinces. This development suggests that pineapple has become a commercial commodity in these three provinces.
Mango
Mango is a seasonal fruit and the major producing areas are in areas with a distinct dry season i.e. East Java, West Java, South Sulawesi and East Kalimantan Provinces. During the 1998 to 2002 period mango production increased from about 600 to 900 thousand tonnes per annum. East Java accounted for 40 to 45 percent of the total 1998 to 2002 mango production, followed by West Java and South Sulawesi, which accounted respectively for 12 to 18 percent and 4 to 8 percent of the total mango production. The increase in production resulted from higher harvested areas and higher average yields.
Rambutan
The production of rambutan increased from 279 to 477 thousand tonnes during the 1998 to 2002 period. The harvested area increased from 46 to 69 thousand ha and the yield from 4.5 to 6.1 tonnes/ha. The major production areas are Java and Sumatera Islands. During this period, the production of rambutan on Java increased from 164 to 199 thousand tonnes. The major producing areas are West Java, East Java and Central Java. During peak seasons, rambutan fruit generally overloads local markets, suggesting that fruit processing industries are needed to conserve the fruits.
Durian
Durian has a high cash value. It is produced seasonally, around November to January. During the 1998 to 2002 period, national production increased from 210 to 347 thousand tonnes. During this period, the total harvested area increased from 26 to 41 thousand ha and yields increased from 8 to 12.8 tonnes/ha). The major areas of production are Java and Sumatera. In 1998, Java accounted for 43 percent of national production (91 thousand tonnes) but the proportion declined to 32 percent (65 thousand tonnes) in 2002.
Avocado
The national production of avocado reached more than 130 thousand tonnes in 1998 and increased to 151 thousand tonnes in 2002. The major areas of production were Java and Sumatera, which together accounted for 80 percent of national production. Their market share rose to 82 percent in 2002. The increases were due to increases in harvested areas and yields. The major production areas were West Java and East Java Provinces.
Salacia
During the 1998 to 2002 period, production of salacia increased from 353 to 467 thousand tonnes, with a peak in 2001 of 681 thousand tonnes. The major producing areas are Java, Sumatera and Bali-Nusa Tenggara, these three regions together accounting for 97 percent of national production.
![]()
![]()
![]()