![]()
![]()
![]()
The total gross area of forest plantations in 89 countries (78 tropical and 11 sub-tropical) was reported to be about 70.85 million ha in 1995, of which 42.1 million ha were in the tropics and 28.8 million ha in sub-tropical countries (Table 1). The distribution of plantations in geographic regions was 76.3% in Asia and Pacific, 14.1% in Latin America and 9.6% in Africa.
In the tropics, the total gross forest plantation area reported in 1995 had decreased compared to 1990. This decrease was mainly due to the reduced gross figure for forest plantation area reported by two major planting countries - Brazil and Indonesia. In Brazil, the gross area in 1995 was 4.8 million ha against 7.0 million ha in 1990, and in Indonesia, it was 5.0 million ha in 1995 against 8.8 million ha in 1990. The total gross forest plantation area in all other countries had however increased since 1990.
China had the largest gross forest plantation area of 21.4 million ha. The Fourth National Forest Inventory of China carried out during 1989 - 93 assessed the total area of the forestry plantation as 34.3 million ha, comprising 11.8 million ha of non-wood products (spices, oil seeds, rubber, etc.) and more than one million ha of bamboo, which had been excluded from the reported figure. The second largest gross area in India was reported from 5 year development plans to be 20.3 million ha - a cumulative area of gross forest plantations established since 1951. The third and the fourth largest forest plantation areas were in Indonesia and Brazil respectively. Viet Nam had the fifth largest plantation area of 2.5 million ha.
Table 1: Forest plantation areas in tropical and sub-tropical countries to 1995 and annual planting rates (1991-1995) (000 ha).
|
Region |
Gross areas |
Net areas |
Annual planting rate |
||||
|
Industrial plantations |
Non-ind. plantations |
Total plantations |
Hardwood plantations |
Softwood plantations |
Total plantations |
||
|
Africa |
|||||||
|
Tropical (37) |
1,315 |
2,070 |
3,385 |
1,843 |
591 |
2,434 |
115 |
|
Sub-tropical (6) |
2,482 |
945 |
3,427 |
1,312 |
2,114 |
3,427 |
173 |
|
Subtotal (43) |
3,797 |
3,015 |
6,812 |
3,155 |
2,706 |
5,861 |
288 |
|
Latin America |
|||||||
|
Tropical (25) |
5,373 |
1,666 |
7,038 |
3,864 |
2,112 |
5,976 |
221 |
|
Sub-tropical (3) |
2,458 |
467 |
2,925 |
1,051 |
1,874 |
2,925 |
170 |
|
Subtotal (28) |
7,831 |
2,133 |
9,963 |
4,915 |
3,986 |
8,901 |
391 |
|
Asia and Pacific |
|||||||
|
Tropical (16) |
14,269 |
17,361 |
31,630 |
17,338 |
1,777 |
19,115 |
1,308 |
|
Sub-tropical (2) |
18,586 |
3,855 |
22,440 |
6,892 |
15,548 |
22,440 |
2,025 |
|
Subtotal (18) |
32,855 |
21,216 |
54,071 |
24,231 |
17,325 |
41,555 |
3,333 |
|
Total Tropical (78) |
20,957 |
21,097 |
42,054 |
23,045 |
4,480 |
27,525 |
1,644 |
|
Total sub-tropical (11) |
23,526 |
5,267 |
28,793 |
9,255 |
19,537 |
28,792 |
2,368 |
|
Grand Total (89) |
44,483 |
26,363 |
70,846 |
32,301 |
24,016 |
56,317 |
4,012 |
Industrial plantations constituted 63% of the gross forest plantation area, 53% of which were located in sub-tropical countries. The distribution of industrial gross forest plantations in the tropical countries was 68% in Asia, 26% in Latin America and 6% in Africa; in sub-tropical countries it was 79% in Asia and Pacific (all in China and Australia), 10% in Latin America and 11% in Africa.
The average annual planting rate during 1991 - 95 was about 4 million ha of which 1.6 million ha was in the tropics and 2.4 million ha in subtropics. There had been a general decline in the annual rate of planting in most tropical countries compared to the 1990 assessment (2.6 million ha). Most of this fall had come from a reduction in the planting programme in India, probably due to reduced funding.
The annual planting in many countries was comprised of a combination of planting in new areas as well as replanting in harvested or destroyed areas. The annual planting therefore did not necessarily mean an increase in total forest plantation area by that full amount in that year. For example, in Chile 40% of the total annual plantation (about 100,000 ha) in 1995 was replanting. In Fiji out of the total plantation of 3,284 ha established during 1995 by Fiji Pine Ltd., replanting was 2,260 ha and the new additional area was only 1,024 ha.
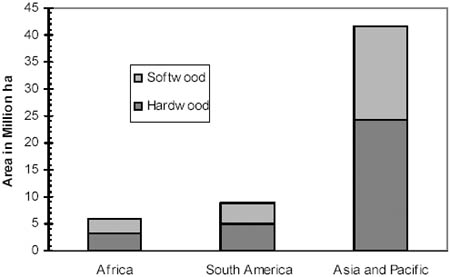
The net area of successfully established plantations in the tropical and sub-tropical countries was estimated to be 56.3 million ha which was almost equally shared between these two zones. The distribution of net planted area in the geographic regions was 74% in Asia and Pacific, 16% in Latin America and 10% in Africa.
Though more than 100 species had been planted, only about 60 species (listed in the previous section) were commonly planted. The net area of softwood was 24.0 million ha. Hardwood species occupied about 57% of the plantations with net area of 32.3 million ha (Figure 1). In tropics, hardwood plantations were dominating: tropical Africa (76%), tropical America (65%) and tropical Asia (91%) all had hardwood plantation areas significantly higher than soft wood plantations.
Figure 1. Net area distribution of hardwood and softwood species among the regions.
Figure 2. Net area occupied by
major hardwood species in forestry plantations.
Among the hardwood species, eucalypts occupied the largest net area of 31.9% (10.3 million ha), followed by other acacias (7.3%), teak (7.0%) and others (Figure 2). Detailed description on distribution of hardwood species in different regions is been given in the next chapter.
Among the softwood species the fast growing pines (P. radiata, P. patula, P. caribaea, P. elliottii and P. oocarpa) occupied about 25% of the area whereas other pines (P. kesiya, P. massoniana, P. merkusii, P. roxburghii, P. halepansis, P. maritime, P. wallichiana) covered about 36%. About 61% of softwood plantations were located in China.
The total reported area of non-forest species by 1995 was assessed as 26.6 million ha, 90% of which was located in Asia and Pacific region, 7% in Latin America and the remainder in Africa (Table 2). About 80% of these plantations were concentrated in five Asian countries namely Indonesia (33%), Malaysia (17%), Philippines (12%), Thailand (9%) and India (8%). The three countries having significant area in the other two regions were Brazil, Colombia and Mexico in Latin America and Nigeria, Tanzania and Cote d’Ivoire in Africa.
Table 2. Reported plantation areas of non-forest species in the tropical and sub-tropical countries in 1995 (000 ha).
|
Region |
Rubber |
Coconut |
Oil Palm |
Total |
|
Latin America (8+) |
238 |
269 |
265 |
772 |
|
Africa (11+) |
530 |
461 |
961 |
1,952 |
|
Asia and Pacific (16+) |
8,718 |
10,546 |
4,587 |
23,851 |
|
Total (35+) |
9,486 |
11,276 |
5,813 |
26,575 |
+ Additional countries having small plantation area but their exact number are unknown.
Coconut (Cocos nucifera) covered the largest area (about 42% of the total), rubber (Hevea brasiliensis) 36% and oil palm (Elaeis guineensis) 22%. The major area of coconut lied in Indonesia (33%) and the Philippines (28%), of rubber in Indonesia (34%), Thailand (21%) and Malaysia (18%) and of oil palm in Malaysia (43%) and Indonesia (29%).
![]()
![]()
![]()