![]()
![]()
![]()
by
Nancy K.Gitonga
Fisheries Department, P.O. Box 58187,
Nairobi, Kenya.
|
Abstract Results of laboratory trials into the effect of salt concentration on oviposition, larval growth and mortality of blowflies, Lucilia and Chrysomya species, found in smoked fish in Kenya indicated that when presented with oviposition media (fish fillet) of a range of salt concentrations, blowflies preferred to oviposit on the medium with the lowest concentration. Chrysomya species oviposited on medium with salt concentration up to 8.7% wwb (37% dwb) while Lucilia species oviposited on salt concentration of up to 10% wwb (39% dwb) in the absence of choice. The larval growth and mortality trials indicated that relatively low concentrations of 7% wwb and 9% wwb, would effectively stop larval growth of Kenyan Chrysomya and Lucilia species respectively and therefore, control infestation of salted fish by the blowflies. Larval growth appear to be completely prevented in fish fillets with salt content over 8% wwb, although it may not be repellent to ovipositing females in the absence of choice. The results of the laboratory investigation suggest that losses of fish in Kenya through blowfly infestation could be prevented or be significantly reduced by salting fish before curing. |
1. INTRODUCTION
The Nile perch (Lates niloticus) is found in lakes Victoria and Turkana in Kenya. Since 1981, the production of Nile perch from Lake Victoria has been steadily increasing and presently contributes approximately 50% of the total fish landings in Kenya. Lake Turkana contributes only 3% of the total Nile perch produced in the country. Other commercial fish species from Lake Victoria include Tilapia species and Rastrineobola argentea.
The demand for Nile perch has steadily increased, due to the increasing number of modern fish processing factories established to process fish for the export market. Despite this demand, heavy post-harvest losses of Nile perch continue to be experienced especially during rainy seasons when landing sites become inaccessible by road and production is at its highest. Traditional curing methods of fish in Kenya include smoking, sun-drying and deep-frying especially for the Nile Perch. Fish brining is not a traditional curing method in Kenya and therefore, the method is rarely practised. Post-harvest losses of cured Nile perch occur during processing, and are most significant during storage. The losses are mainly due to blowfly and beetle infestation, moulds, bacterial spoilage and fragmentation. It is against this background that, the present work was carried out, with the aim of using salt to reduce post-harvest losses resulting from blowfly infestation.
2. MATERIALS AND METHODS
2.1 Materials
- Blowfly populations of L. cuprina & Chrysomya spp
- Cages: an aluminium frame (74 cm x 51 cm x 34 cm) supporting a fine nylon mesh cover
- Overhead heat lamp regulated by thermostat.
- Fresh fish fillets and fresh liver
- Fish fillets brined at 0, 10, 20, 25 and 30% salt concentration (w/v) giving salt content of 0.4, 6.4, 8.7, 9.3 and 10.0 % wwb, respectively. Brined fish fillets were used in larval growth trials while brined minced fish flesh was used for the mortality experiment
2.2 Methods
Maintenance of blowfly population
The population was established from 758 blowfly pupae. The pupae developed from blowfly larvae obtained from smoked Nile perch purchased at the wholesale fish market in Nairobi. When pupae emerged, the two blowfly species were separated into different cages. Two species of Chrysomya (C. chlopyga and C. putoria) were grouped together in one cage and referred to as Chrysoma spp. The Lucilia cuprina was maintained in separate cage. The population was maintained at 27ºC - 30ºC by an overhead heat lamp, regulated by a thermostat. The adult blowflies were reared from larvae that were fed on unsalted fresh cod fillets. After pupation, the newly emerged adults were fed on fresh liver. Sucrose and water were made available to the flies. Each population was maintained for 3-4 weeks before trials commenced, to allow adequate time for ovaries of female adult flies to mature. The flies were deprived of liver for 1 week before each series of trials commenced, to prevent premature oviposition hence reduce incidences of "spent" females during trials.
Oviposition trials
Blowfly species were presented with fish of 4 salt concentrations (6.4. 8.7, 9.3 & 10 % wwb), in a series of 4 trials. Chrysomya spp. was presented with unsalted fish in addition to the 4 salt concentrations in trials C and D. In each succeeding trial choice of salt concentration was progressively reduced by omitting the medium with the lowest salt concentration in the previous trial. During the last trial of the series, the blowflies were presented only with the fish with the highest concentration.
Fish from each salt concentration put in dishes and in triplicate was placed randomly inside the cages. After one hour the number of eggs on each medium was estimated. The estimation was done by weighing the total mass of eggs oviposited and converting the weight into numbers. The average number of eggs per mg that had previously been worked out, was the formula used to calculate the number of eggs. (L. cuprina, 11.3 egg/mg; Chrysomya spp. 5.9 eggs/mg)
Growth and mortality trials
A series of trials was carried out using the laboratory bred blowflies larvae. For each trial, the larvae were reared on fish flesh of 5 salt concentrations (unsalted-0.4, 6.4, 8.7, 9.3 and 10% wwb). At the start of each trial, 1 g sample of fish of each concentration was individually placed on small separate dishes in transparent, plastic jars. Each salt concentration was duplicated. Twenty-five, first instar larvae were carefully transferred to each sample of fish. The jars were closed, using lids, which contained 4 ventilation holes of 1 cm diameter. The holes were covered with fine, nylon mesh to prevent larvae from escaping. The fish was replaced daily from day 2 onwards. The quantity of fish used for each replica was increased to 12 g. The larvae were incubated at 30 oC throughout the trials. At daily intervals, counts were taken of all surviving larvae and the larvae from the two replicates of each salt concentration were weighed on a top pan balance, accurate to 0.0001 g until the onset of pupation. Before being weighed, the larvae were allowed to crawl on a dry filter paper to remove excess moisture and fish particles. The pupae were transferred to pupation medium consisting of peat and returned to the incubator. They were monitored at daily intervals, until adults emerged. After 15 days any unemerged pupae were dissected and stage of development noted.
3. RESULTS AND DISCUSSION
Effect of salt concentration on oviposition by L. cuprina and Chrysomya spp.
Table 1. Effect of salt concentration of fish on oviposition by Lucilia cuprina
|
Series |
Trials |
Salt concentration of fish flesh (%) |
% Eggs on |
|||
|
6.4 wwb |
8.7 wwb |
9.3 wwb |
10 wwb |
|||
|
A |
1 |
2147 |
0 |
0 |
0 |
100 |
|
2 |
x |
3244 |
721 |
0 |
82 |
|
|
3 |
x |
x |
2066 |
78 |
96 |
|
|
4 |
x |
x |
x |
866 |
0 |
|
|
B |
1 |
1657 |
94 |
29 |
0 |
92 |
|
2 |
x |
165 |
48 |
0 |
77 |
|
|
3 |
x |
x |
43 |
0 |
100 |
|
|
4 |
x |
x |
x |
5 |
100 |
|
|
C |
1 |
689 |
81 |
0 |
0 |
89 |
|
2 |
x |
346 |
114 |
0 |
71 |
|
|
3 |
x |
|
44 |
0 |
100 |
|
|
4 |
x |
|
x |
117 |
100 |
|
|
D |
1 |
141 |
0 |
0 |
0 |
100 |
|
2 |
x |
28 |
0 |
0 |
100 |
|
|
3 |
x |
x |
110 |
0 |
100 |
|
|
4 |
x |
x |
x |
5 |
100 |
|
The largest number of eggs was oviposited on the lowest available salt concentration although oviposition was not restricted to fish with the lowest salt concentration (Table 1&2). L. cuprina preferentially oviposited on the fish with the lowest salt concentration (Table 1).
Chrysomya spp. did not readily oviposit on salted fish, but when they did, almost in all cases oviposition occurred on the lowest salt concentration but not beyond 8.7% wwb. (Table 2)
These results suggest that although blowflies tended to oviposit on the lowest salt concentration (i.e. over 70% eggs, in these trials), other factors may also influence oviposition sites. Group oviposition was observed during all trials. This was evident from the large standard deviations, which indicate that oviposition was not spread evenly on the 3 replicates of any salt concentration. Esser (1990) reported similar observations and suggested that the group oviposition may be due to attraction of flies to ovipositing flies, thus outweighing any repellent effects of high salt concentrations.
In the absence of choice, L. Cuprina oviposited on fish with relatively high salt concentration (10% wwb; 39% dwb), although the number of eggs deposited is relatively few (Table 1). The decrease could be due to females being "spent", i.e. few eggs left by trial 4. Chrysomya Spp. did not oviposit on fish with salt concentration beyond 8.7% wwb (37% dwb), even in the absence of choice (Table 2). The low egg numbers suggest females were spent on Trial 3.
In Africa, salted fish are reported by many workers to be unattractive to blowflies (Green, 1967; Mills, 1979; Proctor, 1972; Mclellan, 1963). Walker and Wood (1986) also found that salt inhibited egg laying of unspecified blowflies on salted Haplochromis and Lethrinops spp. during field trials in Malawi. The results of this work tend to contradict these findings, although the blowflies used during the trials originated from Kenya in Africa. This is probably because during the field trials in Malawi and other parts of Africa, the blowflies had the choice of unsalted fish. The results, however, generally agree with the report, that in the absence of choice, C. megacephala from South East Asia oviposited on fish with high levels of salt up to 40% dwb (Esser, 1990). Salt levels of 15% -30 % dwb usually found in S.E. Asian cured fish, do not impart a repellent effect against ovipositing C. megacephala and L. cuprina (Esser, 1988a).
Effect of salt concentration of fish on growth and mortality of L. cuprina and Chrysomya spp.
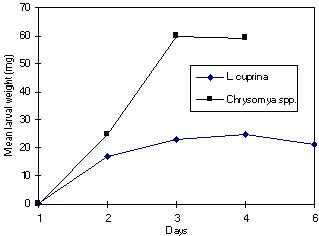
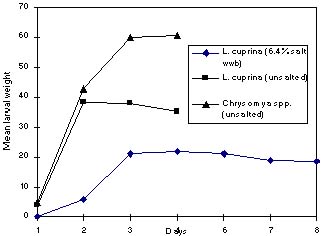
The larval growth curves (Fig 1&2) show that Chrysomya spp. larvae reared on unsalted fish grew most rapidly between the second and third day of larval duration and L. cuprina between the first and second day. Chrysomya spp. showed higher growth rate than L. cuprina.
|
Fig. 1: Larval growth of L. cuprina and Chrysoma spp. On unsalted fish medium at 30ºC
|
|
Fig. 2: Effect of salt content on larval growth of L. cuprina and Chrysomya at 30ºC
|
Table 2. Effect of salt concentration of fish on oviposition by Chrysomya spp.
(a) Series A and B
|
Series |
Trials |
Salt concentration of fish flesh (%) |
% Eggs on |
|||
|
6.4 wwb |
8.7 wwb |
9.3 wwb |
10 wwb |
|||
|
A |
1 |
0 |
0 |
0 |
0 |
0 |
|
2 |
x |
335 |
0 |
0 |
100 |
|
|
3 |
x |
x |
0 |
0 |
0 |
|
|
4 |
x |
x |
x |
0 |
0 |
|
|
B |
1 |
0 |
0 |
0 |
0 |
0 |
|
2 |
x |
0 |
0 |
0 |
0 |
|
|
3 |
x |
x |
0 |
0 |
0 |
|
|
4 |
x |
x |
x |
0 |
0 |
|
(b) Series C and D
|
Series |
Trials |
Salt concentration of fish flesh (% wwb) |
% Eggs on |
||||
|
0.4 |
6.4 |
8.7 |
9.3 |
10.0 |
|||
|
C |
1 |
1545 |
0 |
0 |
0 |
0 |
100 |
|
2 |
x |
19 |
0 |
0 |
0 |
100 |
|
|
3 |
x |
x |
41 |
0 |
0 |
100 |
|
|
4 |
x |
x |
x |
0 |
0 |
0 |
|
|
5 |
|
x |
x |
x |
0 |
0 |
|
|
D |
1 |
373 |
0 |
0 |
0 |
0 |
100 |
|
2 |
x |
294 |
32 |
0 |
0 |
90 |
|
|
3 |
x |
x |
0 |
0 |
0 |
0 |
|
|
4 |
x |
x |
x |
0 |
0 |
0 |
|
|
5 |
|
x |
x |
x |
0 |
0 |
|
Figures are means of number of eggs oviposited on 3 replicates of each salt concentration; X - Omitted salt concentrations
Table 3. Effect of salt content on larval mortality on L. Cuprina and Chrysoma spp
|
Salt content of flesh (wwb) |
% Larval mortality |
|||
|
L. cuprina |
Chrysomya spp. |
|||
|
Trial A |
Trial B |
Trial A |
Trial B |
|
|
0.4 |
10 |
7 |
11 |
9 |
|
6.4 |
100 |
88 |
100 |
100 |
|
8.7 |
100 |
100 |
100 |
100 |
|
9.3 |
100 |
100 |
100 |
100 |
|
10.0 |
100 |
100 |
100 |
100 |
Table 4: Average growth rate of larvae of L. cuprina and Chrysomya spp. over the larval growth period, at 30o C
|
Trial |
Blowfly |
Rearing fish medium |
Mean growth rate mg/day |
|
A |
L. cuprina |
unsalted |
19 |
|
L. cuprina |
salted(all) |
- |
|
|
Chrysomya spp. |
Unsalted |
36 |
|
|
Chrysomya spp. |
salted(all) |
- |
|
|
B |
L. cuprina |
unsalted |
30 |
|
L. cuprina |
salted (6.4% wwb) |
15 |
|
|
Chrysomya spp. |
Unsalted |
42 |
|
|
Chrysomya spp. |
salted (all) |
- |
There was total mortality of both L. cuprina and Chrysomya spp. reared in salted fish during Trial A (Table 3). However, during Trial B, 12 % L. cuprina larvae reared on fish medium of 6.4% wwb salt concentration survived but showed reduced growth rate (Table 3, Fig 2).
Larvae of L. cuprina took longer to pupate (9-10 days) when reared on 6.4% wwb salt concentration fish medium, compared to when reared on unsalted fish medium (7-8 days). However, the pupae from salted fish medium did not emerge, and on examination, the unemerged pupae showed that they had died before developing adult structure.
Only 12% L. Cuprina larvae survived on the salted fish (No Chrysomya larvae survived on salted fish.)
1. The figures are means of percentages larval mortality on 4 consecutive days determined on duplicate samples (8 determinations).
2. Percentage larval mortality was calculated from the number of dead larvae out of the initial 25 that were introduced
The results of these trials on larval growth and mortality appear to differ with recent findings that salt contents in excess of 39.5% dwb are necessary to obtain high larval mortalities of C. megacephala, flies originating from Indonesia (Esser, 1988a). During the trials Esser (1988a) observed that salting the fish had the effect of decreasing the initial growth rate, although salt contents of less than 33.8% dwb had little effect on total amount of larval growth over the extended larval duration (Table 4). This is contrary to the results of present work, where salt concentration of 32.7% dwb, prevented or reduced growth over the complete larval duration. The results of this study, however, agree with some previously published reports. Kordyl (1976) reported that brining lake Tanganyika sardines prevented development of blowfly larvae. Tropical Development and Research Institute (TRDI, 1984), reported that a salt concentration in excess of 8% wwb gave larval control of at least 90% during trials conducted in Malawi.
The results of these trials show that although some L. cuprina larvae reared on fish with 6.4% wwb salt content (32.7 dwb) pupated, they nevertheless did not develop into adults. Esser (1990), however found that some C. megacephala larvae reared on food of relatively high salt concentration (up to 50% dwb) were capable of pupating and emerging as adults.
It is important to note, however, that a few L. cuprina larvae pupated on medium with relatively high concentration (32.7 % dwb), although they did not develop into adults, therefore indicating the possibility for Kenyan blowflies to eventually develop salt tolerance if fish salting techniques are introduced and become extensively used in Kenya consequently depriving blowflies choice of unsalted fish.
Observations
The observed differences in blowfly oviposition behaviour and larval salt tolerance between those from Africa and the ones from S.E. Asia could be due to the S.E. Asian blowflies having evolved a tolerance to relatively high salt concentration found in S.E. Asian cured fish, which are salted before drying. In Kenya and Africa in general, where fish is not usually salted before curing, the blowflies do not appear to have developed any tolerance to high salt concentrations. It is worthy noting here that although the blowflies during these trials oviposited in high salt concentrations in the absence of choice, there was total or very high larval mortality in even the lowest salt concentration (6.4% wwb). These results, therefore, suggest that losses of fish in Kenya, through blowfly infestation could be prevented or reduced by salting the fish before curing. Fish with salt contents over 8% wwb in these trials, appear to prevent larval growth altogether, although they may not be repellent to ovipositing females in the absence of choice. Similar findings have been reported in Malawi (TDRI, 1984).
4. CONCLUSIONS
(i) Blowflies preferentially oviposited on the lowest salt concentration, when given choice of a range of salt concentrations. In the absence of choice, L. cuprina oviposited on relatively high concentrations up to 10% wwb but Chrysomya spp. did not oviposit on salt concentration above 8.7% wwb even in the absence of choice.
(ii) The Chrysomya spp. larvae reared on salted fish showed mortality even on the lowest salt concentration 6.4% wwb used in the trials. A few of L. cuprina larvae reared on salted fish of 6.4% wwb salt content managed to pupate although the growth rate was reduced (50% reduction) compared with those reared on un-salted fish. However, the pupae did not emerge as adults, and died without formation of adult features.
(iii) The blowflies may oviposit on high concentration media in absence of choice, but the larvae are unlikely to develop to adult flies.
5. RECOMMENDATIONS
(iv) There is need for field tests on the applicability of brining fish before curing as one way of reducing post-harvest losses of fish in East Africa, where salting is not extensively used;
(v) More work on acceptability of salted fish by consumers is necessary;
(vi) Marketing of salted fish is another area that needs to be investigated.
6. ACKNOWLEDGEMENTS
The Government of Kenya, the British Council and the International Development Research Centre (IDRC) supported this work.
7. REFERENCES
Esser, J.R. (1988a). Assessment and reduction of insect infestation of cured fish in South East Asia, with laboratory studies on Chrysomya megacephala (Fab), a principal causative agent. PhD. Thesis, University of Durham, UK.
Esser, J.R. (1990). Factors influencing oviposition, larval growth and mortality in Chrysomya megacephala (Diptera: Calliporidae), a pest of salted-dried fish in S.E. Asia (in press)
Green, A.A. (1967). The protection of dried sea fish in South Arabia from infestation by D. Frischii, J, Stored Prod. Res., 2, pp. 331-335
Kordyl, E. (1976). Some protective measures against insect infestation of dried fish in Africa. In: Proceedings of the conference on handling, processing and marketing of tropical fish. London, Tropical Institute, pp 313-314
McLellan, R.H. (1963). The use of pyrethrum dip as protection for drying fish in Uganda Pyrethrum Post, 7(I), pp 8-10
Mills, A. (1979). Handling and processing fish on Lake Chad, 55 p (Unpubl. Proj. Rep.) (Mimeo)
Proctor, D.L. (1972). The protection of smoke-dried fresh-water fish from insect damage during storage in Zambia. J. Stored Prod. Res., 8(2), pp 139-149
Tropical Development and Research Institute (1984). Central Lake Fisheries Development Project, Malawi. Unpublished summary report, London, TRDI
Walker, D.J. and Wood, C.D. (1986a). Non-insecticidal methods of reducing losses caused by infestation of blowflies (Diptera) during fish curing procedures In: Fish processing in Africa. Proceedings of the FAO Expert Consultation on Fish Technology in Africa Lusaka, Zambia 21-25 January 1985. FAO Fisheries Report No. 329 Supplement, pp 374-379
par
Ahmedou O. Maloum
Laboratoire de valorisation des
produits de la pêche
Centre national de recherches
océanographiques et des pêches (CNROP), Nouadhibou,
Mauritanie
|
Résumé Le poisson fermenté séché en Mauritanie est un produit traité et transformé artisanalement. Il constitue une denrée alimentaire très importante. Les techniques utilisées pour sa transformation sont variées et les produits, généralement de qualité médiocre, sont infestés par les insectes ichtyophages (Dermestes sp., Necrobia sp.) Au cours du séchage, la contamination par les insectes et la ré-humidification de ces produits finis durant le stockage et le transport occasionnent beaucoup de pertes, cela constitue un important manque à gagner pour les artisans, un risque sanitaire pour les consommateurs. Les conditions de traitement et de conservation de ces produits (peu hygiénique), la multitude des centres de production et la diversité de la qualité (médiocre) des produits finis constituent de grands obstacles pour le développement d'une transformation artisanale rentable. Vu l'importance de ce secteur vital et la gravité de la situation, le CNROP a initié un programme de recherche visant la standardisation et l'amélioration de la qualité de ces produits. Une première tentative de recherche sur le fermenté séché (guedj) a enregistré pour le produit fini de dorade grise 50-55% de protéine, 17.5-42 % d'humidité avec des taux d'ABVT et de TMA respectivement en valeur moyenne de 241 mg% et 48 mg%. |
1. INTRODUCTION
Le secteur de la pêche en Mauritanie joue un rôle socioéconomique très important. Située dans la partie occidentale de l'Afrique, la Mauritanie pays de contraste entre le monde arabe et l'Afrique noire, dispose d'un littoral s'étendant sur 750 km correspondant à une superficie marine de 234 000 km2 qui a la particularité d'être l'une des plus poissonneuses du monde. La main d'œuvre employée dans le secteur de la pêche est très importante que ça soit dans les emplois directs ou indirects. Les estimations du volume des captures nationales ont atteint au cours de l'année 2000, la pêche industrielle - 633 000 tonnes (source: DCSPM) et la pêche artisanale - 47 000 tonnes (source: CNROP). Les localités qui se trouvent en bordure de la mer sont approvisionnées en produits halieutiques frais, tandis que les villes de l'intérieur et les zones rurales sont ravitaillées en poisson transformé.
En Mauritanie, le mode de transformation le plus connu est la fermentation et le séchage. C'est une technologie très simple et un moyen de conservation peu onéreux. La fermentation est un procédé de traitement et de conservation qui présente de nombreux avantages:
- la simplicité de la technologie;
- le faible coût du matériel à utiliser;
- une faible main d'œuvre
- une grande capacité de traitement.
Ce mode de traitement constitue une importante activité pour beaucoup de citoyens et un libre marché de travail en pleine expansion.
2. LA PRODUCTION DU GUEDJ EN MAURITANIE
La matière première
L'approvisionnement se fait essentiellement à partir des piroguiers; les transformateurs achètent les produits au débarcadère généralement en début d'altération et aux marchés à raison de 1 000 à 1 500 UM la caisse de 20-25 kg. L'espèce et le degré d'altération du poisson font fluctuer le prix de la caisse. En haute saison, les espèces traitées sont: le mulet, requin, liche (Lichia amia), turbot, raie, machoiron (Arius heudelotti), murène, Sparides tandis qu'en basse saison, toutes les espèces sont traitées.
La fermentation
Le poisson est fermenté dans de tonneaux, des cuves ou dans des bassins avec ou sans eau. Généralement, en période de froid, la fermentation se fait sans eau pour augmenter la surface de contact entre le poisson et l'air chaud. Pendant la saison chaude, la fermentation s'effectue dans de l'eau pour éviter une forte altération du poisson par contact direct. La durée de la fermentation (en tonneaux) varie en fonction de l'état du poisson et les conditions climatiques (24-72 heures). Après la réception, le poisson est étêté, éviscéré, tranché puis mis à fermenter.
Le Cymbium (l'escargot de mer) est fermenté par enfouissement dans le sable. Certains artisans mettent le poisson dans des sachets en plastiques avant de les enfouir pour éviter la contamination par les germes telluriques et accélérer les phénomènes d'altération. La fermentation dure en moyenne 6 jours. Le rendement quotidien des hommes transformateurs peut atteindre jusqu'à 70 kg en moyenne tandis que celui des femmes peut atteindre 40 kg. A côté des mauritaniens, ce métier est pratiqué par des sénégalais, maliens, bissau guinéens.
Tableau 1: Durée de séchage du guedj
|
Chaleur |
froid |
||
|
poisson maigre |
poisson gras |
poisson maigre |
poisson gras |
|
4,46 jours |
6,67 jours |
6,7 jours |
9,9 jours |
Durée de séchage
Elle dépend de plusieurs facteurs; la nature du produit (gras, maigre), la température ambiante, l'humidité de l'air, la vitesse de l'air, le temps d'exposition au soleil. Le séchage s'effectue sur des vieux filets accrochés à des piquets en bois.
Le badigeonnement
Cette opération se fait au deuxième jour après l'étalage. Elle consiste à imprégner les poisson maigres de l'huile extraite des graisses de mérou. Elle se fait pour un but esthétique.
Le stockage
Il se fait dans des malles en bois, dans des vieux frigos non opérationnels ou dans des tonneaux. Les poissons sont sortis chaque jour, brossés, étalés et recouverts d'un sac en jute pour couvrir les endroits exposés aux Coleoptères et les Demestes.
Durée de conservation
D'après les transformateurs, la durée de conservation du produit ne dépasse pas un mois.. Les poissons sont stockés dans des endroits ou le ré humidification est bien possible, ce qui favorise le développement des bactéries, les moisissures et les coléoptères, un grand problème que rencontrent les artisans et celui de la conservation des produits finis. Pendant les périodes de surproduction, lors de stockage et avant la commercialisation, les artisans ne suivent plus le produit de près, ne pouvant plus tous les brosser et les étaler sur les claies de séchage. Parfois ils sont obligés de céder leurs marchandises au premier acheteur. Quelques fois, il y a une flambée des prix à cause de la forte demande.
Les différentes étapes s'opèrent avec les mains nues (sans gants) de manière non hygiénique. Les cuves pour la fermentation et les claies de séchage sont très mal entretenues. L'emballage et le stockage du produit sont mal faits de sorte qu'ils favorisent le développement des moisissures.
3. LA QUALITÉ DU GUEDJ TRADITIONNEL
Tableau 2: Analyses chimiques
|
|
Poisson chat |
Dorade grise |
Sardinelle |
Mulet |
Denton |
Psettodes |
Liche |
|
Eaug %g |
31,07 |
26,88 |
17,46 |
17,46 |
21,41 |
41,55 |
37,40 |
|
Matières grasses g%g |
3,95 |
6,41 |
16,56 |
9,74 |
8,30 |
0,45 |
2,14 |
|
Protéines (NT*6.25) g% |
58,00 |
58,50 |
58,50 |
64,50 |
60,25 |
49,95 |
48,00 |
|
Matières minérales g% |
7,09 |
8,16 |
6,71 |
7,95 |
9,74 |
7,84 |
11,07 |
|
Azote non protéique g%g |
2,06 |
1,86 |
1,86 |
1,44 |
1,67 |
157,00 |
2,72 |
|
ABVT mg% |
187,00 |
272,00 |
228,00 |
131,00 |
183,00 |
282,00 |
405,00 |
|
TMA g% |
18,00 |
71,00 |
31,00 |
38,00 |
49,00 |
77,00 |
63,00 |
|
Histamine mg% |
1,40 |
7,60 |
80,50 |
115,00 |
2,40 |
2,90 |
13,50 |
Tableau 3: Analyses microbiologiques
| |
Poisson chat |
Dorade grise |
Sardinelle |
Mulet |
Denton |
Turbot |
Liche |
|
Flore mésophile |
1,7×10⁷ |
1,9×10⁷ |
3×10⁷ |
1,2×10⁷ |
4,6×10⁷ |
5×10⁶ |
1,6×10⁷ |
|
Coliformes fécaux |
³1 et £50 |
³1 et £50 |
³1 et £50 |
³1 et £50 |
³1 et £50 |
³1 et £50 |
³1 et £50 |
|
Staphilo orée |
absence |
absence |
absence |
absence |
absence |
absence |
absence |
|
Anaerobies sulfito |
250 cols/g |
40 cols/g |
50 cols/g |
50 cols/g |
20 cols/g |
250 cols/g |
30 cols/g |
|
Salmonelle |
absence |
absence |
absence |
absence |
absence |
absence |
absence |
L'analyses chimiques et microbiologiques ont donné les résultats suivants (Tableau 20). L'analyses de la qualité du guedj commercialisé Mauritanie a porté sur les espèces suivantes: le machoiron (Arius heudelotti), la dorade grise (Plectorhynchus méditerraneus), le mulet (Mugil cephalus) la carpe rouge (Dentex canariensis) turbot (Psettodes belcheri) et lirio (Lichia amia). L'examen organoleptique a révelé une couleur pas très uniforme, une présence de poussière et une prolifération des larves d'insectes du genre Dermestes spp. L'odeur caractéristique du guedj est fortement présente.
Les échantillons de guedj analysés contiennent 50-55% de protéines, la teneur en humidité varie entre 17,5 et 42% et des taux d'ABVT et de TMA avec des valeurs moyennes respectivement de 241 et 48 mg%. Les analyses ont démontré un taux d'histamine plus élevées pour les poissons pélagiques que les espèces maigres. Les résultats obtenus dans les analyses microbiologiques ne sont pas inquiétants. Il y a seulement une présence anormale de germes anaérobies, les réducteurs de sulfite.
4. LA PRODUCTION DU GUEDJ PAR EXPÉRIMENTATIONS AU LABORATOIRE
(i) Deux lots ont été utilisés pour ces expérimentations: a. un lot expérimental b. un lot témoin
(ii) A une heure donnée de la journée, durant le séchage, la température et l'humidité relative de l'air sont enregistrées ainsi que la pesée du lot expérimental, de même quelques analyses pour le lot témoin sont effectuées.
(iii) Un prélèvement d'échantillons pour la détermination du taux d'humidité et une analyse organoleptique sont effectués à la réception, pendant la fermentation et durant le séchage.
Schéma technologique:
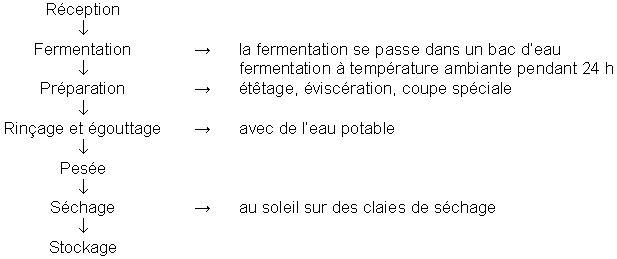
Tableau 4: Séchage du poisson frais et fermenté (Diagramma mediterraneus)
|
Jours |
Heures |
Longueur 40 cm |
Longueur 30 cm |
||||||||||||||||
|
Poisson frais |
Poisson frais |
Poisson fermenté |
|||||||||||||||||
|
ABVT mg% |
TMA mg% |
Humidité% |
Masse, mg% |
ABVT mg% |
TMA mg% |
Humidité % |
Masse, mg% |
Humidité, h% |
Masse, M% |
||||||||||
|
Avec écaille |
Sans écaille |
Filet |
Avec écaille |
Sans écaille |
Filet |
Fermentation, heures |
|||||||||||||
|
24 h |
48 h |
96 h |
24 h |
48 h |
96 h |
||||||||||||||
|
0 |
0 |
18,2 |
8,8 |
79,3 |
100,0 |
100,0 |
100,0 |
18,2 |
88,1 |
79,3 |
100,0 |
100,0 |
100,0 |
79,3 |
79,3 |
79,3 |
100,0 |
100,0 |
100,0 |
|
1 |
12 |
134,5 |
72,9 |
73,6 |
74,3 |
72,0 |
65,1 |
119,2 |
90,7 |
72,9 |
65,8 |
59,9 |
58,6 |
72,2 |
70,6 |
76,7 |
76,5 |
57,0 |
68,0 |
| |
24 |
411,3 |
57,2 |
66,7 |
56,0 |
53,6 |
47,5 |
265,7 |
218,3 |
57,2 |
45,7 |
41,4 |
41,5 |
62,7 |
53,3 |
56,2 |
54,0 |
41,1 |
47,0 |
|
2 |
36 |
626,0 |
421,4 |
60,8 |
46,4 |
43,0 |
38,6 |
384,0 |
312,6 |
33,0 |
38,2 |
33,6 |
34,0 |
44,4 |
29,8 |
41,1 |
44,3 |
31,2 |
38,0 |
| |
48 |
621,0 |
488,0 |
47,0 |
40,1 |
36,0 |
32,9 |
394,0 |
300,0 |
28,0 |
34,5 |
30,8 |
29,2 |
|
|
37,0 |
39,8 |
25,0 |
34,0 |
|
3 |
60 |
|
|
|
35,3 |
32,2 |
29,8 |
368,0 |
303,0 |
|
32,2 |
28,0 |
27,0 |
|
23,5 |
30,8 |
33,3 |
24,1 |
30,0 |
| |
72 |
|
|
|
32,3 |
30,0 |
28,0 |
|
|
|
30,4 |
27,8 |
|
|
|
|
31,3 |
|
|
|
4 |
84 |
|
|
|
31,4 |
29,1 |
27,1 |
|
|
|
30,2 |
26,3 |
|
|
|
28,1 |
31,3 |
|
28,0 |
| |
96 |
|
|
|
|
28,0 |
|
|
|
|
30,2 |
26,3 |
|
|
|
|
|
|
|
|
5 |
108 |
|
|
|
30,4 |
27,1 |
|
|
|
|
29,7 |
|
|
|
|
|
|
|
|
| |
120 |
|
|
|
|
27,3 |
|
|
|
|
|
|
|
|
|
|
|
|
|
|
6 |
132 |
|
|
|
|
|
|
|
|
|
29,6 |
26,2 |
|
|
|
|
|
|
|
| |
144 |
|
|
|
|
|
|
|
|
|
29,8 |
|
|
|
|
|
|
|
|
Tableau 5: Séchage du poisson en fonction de la longueur et de la fermentation
|
Jours |
Heures |
Fermentation=24 h |
Fermentation=36 h |
Fermentation=48 h |
Fermentation=48 h |
Fermentation=96 h |
|||||
|
L=30 cm |
L=35 cm |
L=35 cm |
L=30 cm |
L=30 cm |
|||||||
|
Masse mg% |
Humidité % |
Masse mg% |
Humidité % |
Masse mg% |
Humidité % |
Masse mg% |
Humidité % |
Masse mg% |
Humidité % |
||
|
0 |
0 |
100,0 |
79,3 |
100,0 |
79,3 |
100,0 |
79,0 |
100,0 |
79,3 |
100,0 |
79,3 |
|
1 |
12 |
76,5 |
72,2 |
64,5 |
69,9 |
58,1 |
68,6 |
57,0 |
70,6 |
68,0 |
76,7 |
|
24 |
54,0 |
62,7 |
46,0 |
59,3 |
45,7 |
|
41,1 |
53,3 |
47,0 |
56,7 |
|
|
2 |
36 |
44,3 |
44,4 |
37,2 |
38,8 |
36,1 |
25,4 |
31,2 |
29,8 |
38,0 |
41,1 |
|
48 |
39,8 |
|
35,0 |
|
31,9 |
|
25,0 |
|
34,0 |
37,0 |
|
|
3 |
60 |
33,3 |
|
32,6 |
32,7 |
30,6 |
25,0 |
24,1 |
23,5 |
30,0 |
30,8 |
|
72 |
31,3 |
|
31,3 |
|
30,1 |
|
|
|
|
|
|
|
4 |
84 |
31,3 |
|
29,7 |
|
|
|
|
|
28,0 |
28,1 |
|
96 |
|
|
|
|
|
|
|
|
|
|
|
|
5 |
108 |
|
|
29,0 |
24,4 |
|
|
|
|
|
|
|
120 |
|
|
|
|
|
|
|
|
|
|
|
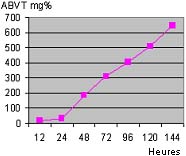
Taux d'ABVT en fonction de la durée de fermentation
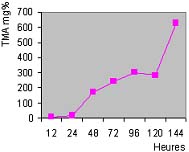
Taux de TMA en fonction de la durée de fermentation
Tableau 6: Séchage du poisson frais (pas fermenté)
|
Jours |
Heures |
Avec écaille |
Sans écaille |
||||||||||
|
Masse |
Humidité |
ABVT |
TMA |
Masse |
Humidité |
ABVT |
TMA |
Masse |
Filet |
Masse |
Filet |
||
|
30 |
30 |
30 |
30 |
40 |
40 |
40 |
40 |
30 |
30 |
40 |
40 |
||
|
0 |
0 |
100,0 |
79,3 |
18,2 |
88,1 |
100,0 |
79,3 |
18,2 |
8,8 |
100,0 |
100,0 |
100,0 |
100,0 |
|
1 |
12 |
65,8 |
72,9 |
119,2 |
90,7 |
74,3 |
73,6 |
134,5 |
104,8 |
59,9 |
58,6 |
72,0 |
65,1 |
|
24 |
45,7 |
57,2 |
265,7 |
218,3 |
56,0 |
66,7 |
411,3 |
350,0 |
41,4 |
41,5 |
53,6 |
47,5 |
|
|
2 |
36 |
38,2 |
33,0 |
384,0 |
312,6 |
46,4 |
60,8 |
626,0 |
421,4 |
33,6 |
34,0 |
43,0 |
38,6 |
|
48 |
34,5 |
28,0 |
394,0 |
300,0 |
40,1 |
47,0 |
621,0 |
488,0 |
30,8 |
29,2 |
36,0 |
32,9 |
|
|
3 |
60 |
32,2 |
|
368,0 |
303,0 |
35,3 |
|
|
|
28,0 |
27,0 |
32,2 |
29,8 |
|
72 |
30,4 |
|
|
|
32,3 |
|
|
|
27,8 |
|
30,0 |
28,0 |
|
|
4 |
84 |
30,2 |
|
|
|
31,4 |
|
|
|
26,3 |
|
29,1 |
27,1 |
|
96 |
30,2 |
|
|
|
|
|
|
|
26,3 |
|
28,0 |
|
|
|
5 |
108 |
29,7 |
|
|
|
30,4 |
|
|
|
|
|
27,1 |
|
|
120 |
|
|
|
|
|
|
|
|
|
|
27,3 |
|
|
|
6 |
132 |
29,6 |
|
|
|
|
|
|
|
26,2 |
|
|
|
|
144 |
29,8 |
|
|
|
|
|
|
|
|
|
|
|
|
| |
156 |
|
|
|
|
29,2 |
|
|
|
|
|
|
|
5. CONCLUSION
Ces premiers essais et analyses de laboratoire ont montré que la qualité du guedj peut être améliorée avec l'utilization des produits frais, la définition de la durée optimale de fermentation, la définition de la durée du séchage, le respect des conditions d'hygiène pendant le traitement et la conservation des produits et l'élaboration des normes de qualité pour les produits finis. La complexité de l'interaction des différents facteurs sur la qualité et l'état hygiénique du fermenté - séché montre la nécessité de poursuivre les expérimentations dans le but de définir des normes standard pour la transformation et la conservation traditionnelle du fermenté séché (guedj). La sensibilisation et la formation des artisans sur les normes de qualité, l'uniformisation et l'instauration d'un système de suivi sont les seules garanties pour la production des produits salubres et de qualité compétitive.
6. RÉFÉRENCES BIBLIOGRAPHIQUES
THIAM (1987). Traitement traditionnel et conservation des produits de la pêche en Mauritanie.
Bulletin CNROP.
CTA (1993). Conserver et transformer le poisson- Guide technique, 287 p.
FAO (1996). Assurance qualité des produits de la mer-FAO. Doc Tech. Pêches (334)-186 p.
Le Cœur, C. (1994). Pêche en Mauritanie du désert à la mer à l'approbation d'un halieute -370p.
Bahi, O., Beye et al. (1997). Rapport final sur l'enquête permanente de suivi des pêches imraguen du banc d'arguin (SPI)- Juillet, 1997
Tall, A. et Cheikh, M.O. Guedj: artisans et procédés de traitement dans la localité de Nouadhibou.
Morosov, et al. Bulletin CNROP.
![]()
![]()
![]()