![]()
![]()
![]()
by/par
Juraj Holcík and Ivan Bastl
Laboratory of Fishery Research and Hydrobiology
Slovak Academy of Agriculture, Bratislava
Czechoslovakia/Tchécoslovaquie
ABSTRACT
Methods of sampling and population estimation of fish used during ichthyological research on arms of the Czechoslovak-Hungarian stretch of the Danube River are described. A specially constructed small mesh seine (of conical shape with a bag, length 80 m, depth in centre 744 cm, at wings 440 cm, mesh size 10 × 10 mm) was used for sampling. Schnabel's formula has been used for calculation of population number, and particular formulae for the confidence limits calculated in accordance with the type of distribution of marked fishes in the population using the criteria of Chapman. Some details on selectivity of fishing gear, field operation, selection of subsamples size with regard to the frequency of size groups, calculation biomass and duration of estimation are introduced.
RESUME
Cette communication décrit les méthodes d'échantillonnage et d'évaluation de populations piscicoles employées au cours de la recherche ichtyologique des bras du cours du Danube tchéco-hongrois. Il a été procédé à l'échantillonnage au moyen de sennes hissées à petite maille, spécialement conçues (de forme conique, à poche, de 80 m de long, de 744 cm de profondeur au centre et de 440 cm aux ailes, maille de 10 × 10 mm). On s'est servi de la formule de Schnabel pour le dénombrement des populations, et de formules spéciales pour le calcul des limites de confiance en conformité avec le type de distribution des poissons marqués dans la population au moyen des critères de Chapman. On donne des détails sur la sélectivité des engins de pêche, les opérations sur le terrain, la sélection de souséchantillons de tailles d'après la fréquence des groupes de tailles, le calcul de la biomasse et la durée de l'évaluation.
CONTENTS
1. INTRODUCTION
2. RESULTS
2.1 The Seine
2.2 Field Operations
2.3 Population Number and Biomass
3. CONCLUDING REMARKS
REFERENCES
The Czechoslovak-Hungarian stretch of the River Danube (1 707–1 880 km) is characterized by an extensive floodplain with many arms, lakes, ponds and oxbows which are permanently or periodically connected with the main stream. Both sport and commercial fishing are concentrated in these waters because of strong current, extensive shipping and increasing pollution of the main stream. The area of all backwaters in this region is 3 140 ha as compared with the 4 974 ha of the main stream. The mean width of the arms varies from 30 to 250 m, and maximum depth up to 11 m.
Because the nature of the shore in the arms allows the use of seines for quantitative evaluation of fish populations, this type of fishing gear has been in use since 1968. In order to capture small species and young fish as well as larger ones, we have chosen a small mesh seine with bag. Our experience and methods used during the past five years in one of the arms belonging to the Vojka arm system (1 840–1 835 km) are described here. The blind arm Zofín is closed by a shore dam at one end and its mouth enters the main Vojka arm which is permanently connected with the main stream. The length of the Zofin is about 620 m and the mean width 64 m. The area varies from 1.2 to 3.8 ha, mean depth from 30.6 to 116.6 cm, and maximum depth from 120 to 396 cm. All dimensions are influenced by the water level in the main stream, being high in the middle of July and low during autumn and winter. More details are given in Holcík and Bastl (1973). There are 20 species on average in this arm. The estimation experiments were made twice a year, during approximately the same dates of July and October.
Construction: The seine is made from silon (polyamide fibre) twine 120/15 × 3, mesh size 10 × 10 mm in squares. Its length is 6 620 meshes, i.e., 80 m, the depth at the wings 440 cm and 744 cm at the centre. A special construction allows the seine to be made from one piece of netting and form its conical shape. During the haul the centre forms a bag of different length and depth depending on the depth of water. This shape was reached by stringing different numbers of meshes into particular sections of the net, i.e., by a combination of different ways of hanging, as seen from Table I (Bél, 1968). The floatline bears floats made from high-pressure polystyrene of ellipsoidal shape, 4.5 cm in diameter and 9 cm in length which are placed at 40 cm long sections of floatline each. The sinkers on the leadline are from cast lead situated in such a way that at every 100 cm there is one sinker weighing 60 g and at every 500 cm a sinker of 120 g.
Selectivity: The minimum size of fish caught by this type of net is shown in Table II. Of course, there is some selection by size group which depends on the body shape of particular species. Deep-bodied species are more vulnerable than the slender-bodied ones. So in Alburnus alburnus the net is fully selective for fish beginning from 90 mm of standard length, in Gymnocephalus (Acerina) cernua for fish from 60 mm, for Perca fluviatilis, Abramis brama and Abramis bjoerkna from 50 mm. Some impression of the selectivity in smaller- size groups in bleak and ruffe is given in Table III. This type of seine is highly selective against such species as Cobitis taenia, Gobio albipinnatus, Rhodeus sericeus amarus and Proterorhinus marmoratus, which were caught only exceptionally, i.e., for fish with extremely slender body or small-sized species. At the same time, bigger specimens of Leuciscus cephalus are not vulnerable to this net. Obviously, the latter escapes from the seine during the haul operation before its pulling at shore. To catch this species gillnets were used.
Sampling of fish: Immediately after arrival at the arm its mouth is blocked by a net bar with 10 × 10 mm mesh size so that the whole water column from its bottom to the surface is closed to prevent emigration or immigration of fish from and to the arm. Fishing is performed equally in the whole area. The number of hauls per day depends on the size of catch and speed of its subsequent examination. Sampled fish is gathered together and held in baskets or in fish receptacles made from net.
Examination of fish: Captured fish are identified, counted, measured, weighed, marked and released. For marking fin-clipping is used and the dorsal fin is cut off. Regeneration is relatively fast but the fish marked in July may still be recognized in the following October. Examination of fish and release are carried out at one place in the centre of the arm During previous experiments, when fish marked by combinations of clipping different fins, were released at different places, we noted that dispersion of marked fish is equal over the whole arm within the first 2–3 hours after release. Under the term “catch”, the sum of catches from several hauls is understood. These are combined, particularly if only a few fish are caught in certain hauls. If the number of captured fish is large, the catch of one haul only is considered.
In order to ensure the fastest possible examination and thus also the shortest period for the estimation, a subsample consisting of the 600 first handled specimens was measured to derive the length frequency of population of the most numerous species. We have thus analysed the catch of Alburnus alburnus (3 500 specimens) and Gymnocephalus cernua (900 specimens), the two most numerous species at the beginning of our investigation (summer 1969). The catch divided into successive subsamples amounting to 100 specimens each was examined for: (i) mean standard length; (ii) percentage frequency of particular 10 mm size groups; and (iii) biomass of population. Differences between subsamples and the whole sample were tested using the “t” test and “x2” test. Results obtained (Tables IV - IX, (Figure I) show that though the differences in any case are not significant either in Alburnus alburnus or Gymnocephalus cernua, the size of the subsample measured for the length frequency of the population should be 700–800 specimens in the first species and 200–400 specimens in the second to reach the 95 percent level of reliability. Because the number of specimens caught in any one species only rarely exceeded 1 000 fishes the subsample consisting of 600 specimens has been considered to be sufficient mainly with regard to calculation of the biomass. In species where the whole catch was under this level all specimens were measured. Obviously the size of subsample depends also on the size of the species. In species with larger numbers of size groups the subsample should also be larger. In our experiments, however, the catch of bigger species (Abramis brama, Leuciscus cephalus, Vimba vimba, Esox lucius, Chondrostoma nasus, Stizostedion lucioperca, Aspius aspius, Barbus barbus, Leuciscus idus and Cyprinus carpio) was usually represented by 100–200 specimens only. In ten estimations the total catch of 1 000 specimens of these species has been exceeded only in Abramis brama (three times) and in Leuciscus idus (once).
In order to later analyse age and growth, measuring and weighing of 20 specimens in each size group of each species were performed and the key scales were taken.
Estimation of population: Schnabel's method has been used to calculate the population number
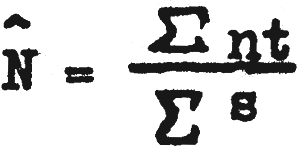
where n represents the number of fish in the sample, t is the total number of marked fish in population present at the day of sampling, and s is the number of marked fish recaptured in the sample.
All dead or injured specimens found in the catch, both marked and unmarked (m) were subtracted from the number of marked and released fish at that day (d) in order to correct the relevant (t).
Calculation of 95 percent confidence limits was made on the basis of the criteria of Chapman (1948) according to the type of distribution of marked fish in the population. In the case of Poisson distributions we used the values tabulated by Chapman (1948) and completed by Kubáĉek and Kusková from the Institute of the Theory of Measurements, Slovak Academy of Sciences (Holĉík and Hensel, 1972, Table VII), and the graph of Clopper-Pearson (1934) in the case of binomial and normal distributions. If the number of recaptures exceeded 100 specimens we used Chapman's formula

Calculation both of  and its confidence limits was performed directly in the field at
at the end of each day using the mechanical hand-calculator. The estimation has been
considered finished when in the dominant species (mostly 1, rarely 2 and uniquely 3 species)
became relatively stable. In this case only the confidence limits showed narrowing (Table X).
Sometimes it was observed in less numerous species that in later samples recaptures were
absent. In such cases the estimation has been considered as terminated on the last date,
when the recaptures were present.
and its confidence limits was performed directly in the field at
at the end of each day using the mechanical hand-calculator. The estimation has been
considered finished when in the dominant species (mostly 1, rarely 2 and uniquely 3 species)
became relatively stable. In this case only the confidence limits showed narrowing (Table X).
Sometimes it was observed in less numerous species that in later samples recaptures were
absent. In such cases the estimation has been considered as terminated on the last date,
when the recaptures were present.
We tried to estimate roughly also the population number in those species, in which
populations were so small that no recaptures were taken (other species). We calculated the
ratio between the sum of population estimation in all estimated species (∑ ) and the
corresponding sum of lower (∑ N) and upper (∑ N) confidence limits respectively and the
sum of the number of first handled specimens (∑ t) to which the sum of the dead first-handled
specimens was added. Then the number of specimens caught of other species was multiplied
by the former ratios. As follows from Table XI the population density of other species was
very low though in some cases their number reached or was equal to the number of the estimated
ones.
Abundance and biomass: The result of population estimation () is considered to
represent the abundance of species (with regard to selectivity of the gear used). Using
the percentage length frequency in a subsample (or length frequency of the whole catch of
less numerous species) the number of fish of particular size groups in the whole population
was found.
The biomass of each species in the sum of the biomasses of all the individual size groups calculated by multiplication of the abundance of the size group by its mean weight. Mean weight was derived from regression equations calculated separately for each species and season respectively on the basis of data from the subsample taken for ageing. When a species was represented by few size groups only and the length-weight equation could not be calculated the “mean regression equation” was used by averaging equations of particular species from corresponding seasons. In the case of other species their actual mean weight was used.
The mean weight of a single (mean) fish of each species, i.e., the biomass of species divided by its abundance, has been used to find the lower and upper limits of estimation of biomass.
By the use of the seine method described population estimation in the examined area was performed during 5–9 working days. The number of hauls necessary varied from 5 to 21 per field excursion. One field experiment required 6.4 days of 13.6 hauls in average, i.e., 2.13 hauls per day. The duration of an estimation as well as the number of hauls necessary depends both on the size of the locality and on the density of the fish stocks which, in our case, were under the influence of the water level in the main stream (higher in summer months and low in autumn). So the average number of sampling days in summer was 7.2 and each day required 2.25 hauls, while in autumn the mean number of sampling days was 5.6 and the mean number of hauls 1.96 per day. It is considered that in this case population estimation is sufficiently short to obviate correction for mortality. In all experiments 7–9 men participated, 5 men assisting in the examination of the catch and the rest preparing the seine for the next sampling.
A modification of the method described was used when population estimation has been performed in the larger arm. In this case the chosen section of the arm measuring from 0.3 to 0.5 ha was blocked with two net bars. Estimation lasted two days only, which required four and seven hauls respectively. Sample examination and corresponding population estimation was made for each sampling respectively.
It is clear, that the population density found, which varies from season to season, represents an instantaneous state which is under the strong influence of fish migrations from the main stream and vice versa.
| 1 | 0 | 10 | 20 | 25 | 30 | 35 | 40 | 45 | 50 | 55 | 60 | 70 | 80 = | length of seine in m |
| 2 |  | length of section in m | ||||||||||||
| number of mesh in field (10 cm) | ||||||||||||||
| 6/6 | C | 6/6 | dividing of mesh number into half field (5 cm) | |||||||||||
| 3 | 3/3 | 3/4 | 4/4 | 4/5 | 5/5 | 5/6 | 7/7 | 5/6 | 5/5 | 5/4 | 4/4 | 4/3 | 3/3 | |
| 6/7 | 6/7 | |||||||||||||
• = 1 m
| Species | Minimum standard length in mm | Species | Minimum standard length in mm |
|---|---|---|---|
| Esox lucius | 111 | Abramis sapa | 65 |
| Rutilus rutilus | 42 | Abramis ballerus | 66 |
| Rutilus pigus virgo | 73 | Vimba vimba | 65 |
| Leuciscus leuciscus | 43 | Rhodeus sericeus amarus | 53 |
| Leuciscus cephalus | 43 | Carassius carassius | 57 |
| Leuciscus idus | 44 | Cyprinus carpio | 48 |
| Scardinius crythrophthalmus | 47 | Cobitis taenia | 80 |
| Aspius aspius | 39 | Misgurnus foseilis | 150 |
| Tinca tinca | 120 | Stizostedion lucioperca | 50 |
| Chondrostoma nasus | 58 | Perca fluviatilis | 41 |
| Gobio gobio | 56 | Gymnocephalus cernua | 34 |
| Gobio albipinnatus | 77 | Gymnocephalus baloni | 61 |
| Alburnus alburnus | 57 | Gymnocephalus schraetser | 43 |
| Abramis bjoerkna | 46 | ||
| Abramis brama | 30 |
| Species | Size Group | Not vulnerable | Vulnerable | ||||
| Number of fish | Mean standard length (mm) | Mean body Number of fish depth (%of st. length | in % | Mean standard length (mm) | Mean body depth (% of st. length) | ||
| 71–80 | 80.0 | 74.5 | 20.6 | 20.0 | 80.0 | 22.2 | |
| lburnus alburnus | 81–90 | 41.7 | 85.6 | 20.9 | 58.3 | 86.6 | 21.5 |
| 91–100 | - | - | - | 100.0 | 96.1 | 21.4 | |
| 51–60 | 58.3 | 55.8 | 24.8 | 41.7 | 59.0 | 24.6 | |
| ymnocephalus cernua | |||||||
| 61–70 | - | - | - | 100.0 | 65.2 | 25.6 | |
| n | x | s | sx | t | p % |
|---|---|---|---|---|---|
| 100 | 105.390 | 0.77968 | 0.07797 | 0.033 | 97.6 |
| 200 | 105.315 | 0.76862 | 0.05435 | 0.659 | 51.1 |
| 300 | 105.337 | 0.76376 | 0.04410 | 0.524 | 61.1 |
| 400 | 105.250 | 0.75333 | 0.03767 | 1.570 | 12.1 |
| 500 | 105.282 | 0.74194 | 0.03318 | 1.340 | 19.2 |
| 600 | 105.277 | 0.71887 | 0.02935 | 1.536 | 13.2 |
| 700 | 105.294 | 0.73327 | 0.02771 | 1.400 | 17.4 |
| 800 | 105.316 | 0.72972 | 0.02580 | 1.130 | 26.1 |
| 900 | 105.333 | 0.72648 | 0.02422 | 0.910 | 37.6 |
| 1 000 | 105.329 | 0.72921 | 0.02306 | 1.030 | 31.3 |
| 1 500 | 105.347 | 0.72605 | 0.01875 | 0.850 | 40.8 |
| 2 000 | 105.377 | 0.72792 | 0.01628 | 0.190 | 85.9 |
| 2 500 | 105.380 | 0.72222 | 0.01444 | 0.140 | 89.6 |
| 3 000 | 105.362 | 0.71387 | 0.01303 | 0.680 | 49.7 |
| 3 500 | 105.385 | 0.72394 | 0.01224 | - | - |
| n | x2 | p % |
|---|---|---|
| 100 | 7.99 | 53.6 |
| 200 | 13.50 | 16.0 |
| 300 | 7.15 | 62.2 |
| 400 | 8.37 | 50.0 |
| 500 | 5.06 | 82.0 |
| 600 | 4.35 | 88.4 |
| 700 | 3.41 | 94.5 |
| 800 | 2.53 | 97.9 |
| 900 | 1.91 | 99.08 |
| 1 000 | 1.45 | 99.30 |
| 1 500 | 0.46 | 99.78 |
| 2 000 | 0.22 | 99.89 |
| 2 500 | 0.08 | 99.96 |
| 3 000 | 0.13 | 99.94 |
| n | x2 | p % |
|---|---|---|
| 100 | 5.24 | 80.4 |
| 200 | 6.07 | 72.9 |
| 300 | 4.69 | 85.3 |
| 400 | 6.11 | 72.5 |
| 500 | 3.98 | 91.0 |
| 600 | 3.82 | 92.1 |
| 700 | 2.69 | 97.5 |
| 800 | 1.98 | 99.05 |
| 900 | 1.61 | 99.23 |
| 1 000 | 1.22 | 99.41 |
| 1 500 | 0.40 | 99.81 |
| 2 000 | 0.25 | 99.88 |
| 2 500 | 0.07 | 99.97 |
| 3 000 | 0.17 | 99.92 |
| n | x | s | sx | t | p % |
|---|---|---|---|---|---|
| 100 | 75.950 | 1.08995 | 0.108995 | 0.241 | 82.1 |
| 200 | 75.940 | 1.20333 | 0.08509 | 0.265 | 80.3 |
| 300 | 75.863 | 1.03826 | 0.05994 | 0.099 | 92.7 |
| 400 | 75.888 | 1.04515 | 0.05226 | 0.044 | 96.7 |
| 500 | 75.902 | 1.05090 | 0.04700 | 0.132 | 90.2 |
| 600 | 75.932 | 1.06552 | 0.04350 | 0.351 | 74.0 |
| 700 | 75.924 | 1.05627 | 0.03992 | 0.320 | 76.3 |
| 800 | 75.903 | 1.05499 | 0.03730 | 0.172 | 87.2 |
| 900 | 75.881 | 1.06473 | 0.03549 | - | - |
| n | x2 | p % |
|---|---|---|
| 100 | 5.83 | 66.7 |
| 200 | 2.67 | 95.3 |
| 300 | 2.25 | 97.2 |
| 400 | 1.55 | 99.1 |
| 500 | 1.02 | 99.4 |
| 600 | 0.55 | 99.7 |
| 700 | 0.57 | 99.7 |
| 800 | 0.17 | 99.9 |
| n | x2 | p % |
|---|---|---|
| 100 | 8.27 | 41.5 |
| 200 | 3.57 | 89.2 |
| 300 | 1.98 | 98.1 |
| 400 | 1.67 | 98.9 |
| 500 | 1.06 | 99.4 |
| 600 | 0.47 | 99.7 |
| 700 | 0.42 | 99.7 |
| 800 | 0.15 | 99.9 |
| Species | Date | ∑ n.t. | ∑ s | | N | N | Confidence limits calculated |
|---|---|---|---|---|---|---|---|
| according to distribution | |||||||
| 11.X.1969 | 168715353 | 8691 | 19413 | 19114 | 19719 | normal | |
| Alburnus Alburnus | 12.X.1969 | 211010078 | 10617 | 19875 | 19557 | 20200 | normal |
| 13.X.1969 | 289163718 | 14229 | 20322 | 20060 | 20590 | normal | |
| 22.X.1970 | 2780 | 7 | 397 | 156 | 859 | Poisson | |
| Gymnocephalus cernua | 23.X.1970 | 7840 | 34 | 231 | 166 | 344 | binomial |
| 24.X.1970 | 11968 | 48 | 249 | 168 | 341 | binomial | |
| 6.X.1973 | 173830019 | 1043 | 16666 | 15756 | 17638 | normal | |
| Abramis bjoerkna | 7.X.1973 | 39637355 | 2154 | 18402 | 17709 | 19127 | normal |
| 8.X.1973 | 74673889 | 4212 | 17729 | 17298 | 18176 | normal |
| Year | Date | Number of hauls | Number of estimated species a (sum of first handled specimens) | Number of other species a (sum of first handled specimens) | Coefficient ∑ N : ∑ t | ||
| ∑ : ∑ t | ∑ N : ∑ t | ∑ N : ∑ t | |||||
| 1969 | 3.-11.VII. | 15 | 10 (15586) | 10 (48) | 7.31 | 6.13 | 9.49 |
| 8.-13.X. | 13 | 16 (15243) | 2 (3) | 2.22 | 2.12 | 2.45 | |
| 1970 | 9.-16.VII. | 18 | 16 (4129) | 10 (45) | 3.87 | 2.80 | 9.00 |
| 20.-24.X. | 15 | 20 (803) | 2 (6) | 3.11 | 1.25 | 12.81 | |
| 1971 | 8.-14.VII. | 14 | 19 (10058) | 8 (13) | 4.66 | 3.75 | 5.94 |
| 13.-17.X. | 5 | 17 (13701) | 5 (6) | 2.15 | 1.93 | 2.61 | |
| 1972 | 7.-12.VII. | 13 | 15 (10379) | 4 (36) | 3.66 | 3.03 | 7.96 |
| 13.-18.X. | 16 | 16 (2387) | 1 (2) | 1.57 | 1.21 | 2.71 | |
| 1973 | 3.-8.VII. | 21 | 13 (7555) | 7 (52) | 4.33 | 3.33 | 6.03 |
| 3.-8.X. | 6 | 17 (17640) | 2 (11) | 1.79 | 1.65 | 2.00 | |
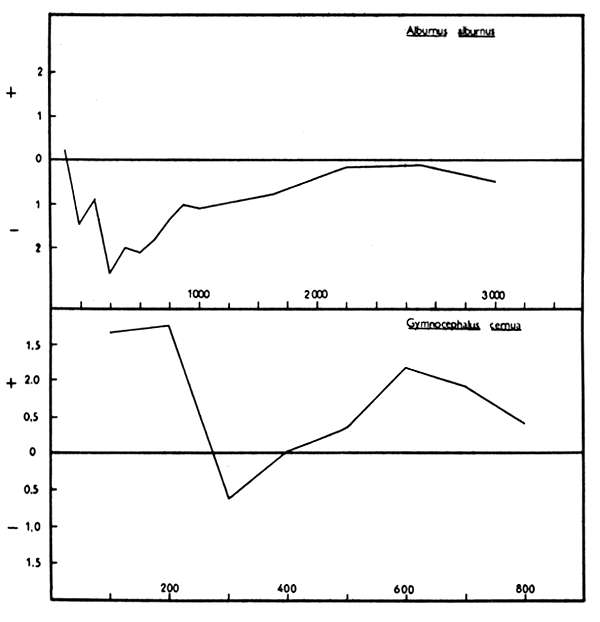
Figure 1 Differences (in percent) of the total biomass of Alburnus alburnus and Gymnocephalus cernua populations respectively, calculated according to frequency of size groups of particular samples in comparison with the biomass derived according to frequency of size groups of the total catch. Abscissa - size of sample, ordinate - differences in percent.
![]()
![]()
![]()