![]()
![]()
![]()
by
T. RAJYALAKSHMI and M. RANADHIR
Central Inland Fisheries Research Institute (K.G. Unit)
Rajahmundry-3, Andhra Pradesh, India
Abstract
Macrobrachium malcolmsonii is the only freshwater prawn of commercial importance in the River Godavary. Its annual yield of about 80 tons makes up about 30 percent of the landings of fish and prawns from the river.
The population studied is isolated from the rest of the river for seven months in each year by barriers across the river in two regions 189 km apart. Methods of survey, trends in prawn yields, and catch/effort relationships are discussed. Methods of data collection and computation and their shortcomings are examined. Statistics of production are utilized to assess indices of population density and for a preliminary appraisal of population characteristics.
The area is divided into two sub-areas and the commercial population is confined to one of these from January to June. Breeding lasts from July to October with two peaks. The variable pattern of floods has some effect on the survival of larvae. An interesting juvenile mass movement occurs from October to January. Intense harvesting of these juveniles and factors affecting the survival of larvae are postulated as two of the reasons contributing to fluctuations in total yields.
LA CREVETTE Macrobrachium malcolmsonii (H. MILNE EDWARDS) DE LA GODAVARI ETUDE SUR L'EVOLUTION ET LES CARACTERISTIQUES DE LA POPULATION EN 1963–66
Résumé
Dans la Godavari, Macrobrachium malcolmsonii est l'unique crevette d'eau douce revêtant une importance commerciale. Son rendement annuel est d'environ 80 tonnes et représente approximativement 30 pour cent des apports de poissons et de crevettes de ce fleuve.
La population étudiée est isolée du reste du fleuve pendant sept mois chaque année au moyen de barrières installées en travers du cours d'eau dans deux régions distantes de 189 km. Les auteurs examinent les méthodes d'étude, l'évolution des rendements en crevettes, et les rapports capture/effort de pêche. Ils étudient les méthodes de rassemblement et de calcul des données, ainsi que leurs inconvénients. Les statistiques de la production servent à déterminer les indices de densité de la population et à évaluer à titre préliminaire les caractéristiques de celle-ci.
La région est divisée en deux zones, la population “commerciale” étant confinée dans l'une de celles-ci du mois de janvier au mois de juin. La période de reproduction s'étend de juillet à octobre, avec deux pointes d'activité maximale. Le régime variable des inondations influe quelque peu sur la survie des larves. Une intéressante migration massive de jeunes s'observe d'octobre à janvier. Selon les auteurs, l'intensité de la pêche de ces stades juvéniles et l'effet des facteurs qui influent sur la survie des larves sont deux des raisons qui expliquent les variations du rendement total.
LA POBLACION COMERCIAL DE LANGOSTINOS Macrobrachium malcolmsonii (H. MILNE EDWARDS) DEL RIO GODAVARY EXAMEN DE LAS TENDENCIAS Y CARACTERISTICAS DE LA PRODUCCION DURANTE 1963–66
Extracto
Macrobrachium malcolmsonii es el único langostino de agua dulce de importancia comercial en el río Godavary. Su rendimiento anual que es de unas 80 toneladas constituye el 30%, approximadamente, de los desembarques de pescado y langostinos obtenidos en el río.
La población estudiada es aislada del resto del río durante siete meses al año con barreras que cruzan el río en dos regiones separadas por 189 km. Se analizan los métodos de reconocimiento, las tendencias de los rendimientos de langostinos, y las relaciones captura/esfuerzo. Se examinan los métodos de recogida y computación de datos y sus defectos. Las estadísticas de producción se emplean para determinar los índices de densidad de la población y para realizar evaluaciones preliminares de las características de las poblaciones.
La zona se divide en dos subzonas y la población comercial se limita a una de éstas desde enero a junio. La cría dura desde julio a octubre con dos puntos máximos. La variabilidad de las inundaciones tiene algunos efectos en la supervivencia de las larvas. De octubre a enero tiene lugar un interesante movimiento en masa de las formas juveniles. Se sugieren como dos de las razones que contribuyen a las fluctuaciones de los rendimientos totales, la intensa recolección de ejemplares en fase juvenil y los factores que influyen en la supervivencia de las larvas.
The Godavari is one of the famous rivers rising in the Western Ghats of India, running through the Deccan plateau and entering the Bay of Bengal, in Andhra Pradesh. It is never completely dry.
The freshwater prawn fishery has been studied in a stretch of the river 189 km in length. It is a single species fishery which contributes more than any other fish or prawn to the total landings from this stretch and averages about 30 percent of the total catch. The annual yield fluctuates around 80 tons, and in 1964 it reached a maximum of 110 tons. Estimates from markets show the prawn landings to yield increasing gross receipts through the years.
In this fishery migrating juvenile prawns of 10 to 20 mm are harvested in large quantities for sale as dry or fresh prawns. In recent years there have been some experimental attempts to transplant juveniles for growth in reservoirs, ponds and fish farms. There is every reason to assume that both these factors have great repercussions on the adult commercial fishery which shows high fluctuations each year.
Any management programme envisages detailed studies of reactions of populations to different exploitation levels. These, along with the studies on yield and its prediction, require detailed catch/effort statistics. A survey and sampling programme was initiated during the year 1963, which formed part of the programme of investigation on the commercial fisheries of the River Godavary. The present paper deals with the annual trends in prawn production, detailed statistics of the effort and yield, and trends in the yield in the different fishing grounds during the four years of study (1963 to 1966). Commercial statistics are used to study the characteristics of the population.
2.1 Exploited species
Two members of the subfamily Palaemoninae are normally present in the freshwater zone of the river, but only Macrobrachium malcolmsonii (H. Milne Edwards) is important in the fishery. The other species is M. scabriculum (Heller) which contributes less than 0.01 percent of the yield. In times of flood, the small prawn M. lamarrei (H. Milne Edwards) occasionally gets access to the river from adjacent ponds and canals. M. malcolmsonii is fished from the upper tidal reaches of the river along almost its entire length. Ibrahim (1962) recorded that the commercial exploitation extended 800 km upstream of the Rajahmundry township but is mainly confined to (i) Rajahmundry (in the State of Andhra Pradesh) at a distance of 80 km from the sea, (ii) Sironcha (in the State of Maharashtra) 450 km from the sea and (iii) Nanded (also in Maharashtra) 800 km from the sea.
2.2 Region
The investigations were carried out in the first of the three areas detailed above. This region is a navigable length of 189 km; it is barred both at its upper and lower regions by anicuts (Fig. 1) which isolate it for about seven months in each year, from November to June. Downstream, about 20 km from the lower anicut, is the upper tidal limit of the estuary of the river. The prawn population here is limited by the salinity. Upstream beyond the upper anicut, the population is very sparse for about 250 km and then becomes once more concentrated near the townships of Sironcha and Nanded.
The months July to October comprise the flood period of the river. Fishing from boats is suspended during this period, and castnets and other minor gear are operated from the shore during periods of recession of the floods. This flood season is also the main breeding season of the prawn population.
| SUB-AREA:I (18860 He) | SUB-AREA:II (16600 He) | ||
| a.h | a.w.f | a.h | a.w.f. |
| 1. 8495 | 0.4504 | 5. 3080 | 0.1855 |
| 2. 380 | 0.0201 | 6. 5345 | 0.3219 |
| 3. 6385 | 0.3385 | 7. 8175 | 0.4924 |
| 4. 3600 | 0.1908 | ||
Fig. 1 (A) Map of River Godavary showing the area of investigation. Thick line across the river indicates division into sub-area I and sub-area II. The sand bars in the river are deleted from the figure. Numbers 1 to 7 are the sub-sub-areas. a.h.: area in hectares; a.w.f.: areal weighting factor.
(b) Enlarged figure of sub-area I showing details of the sub-area structure.
During the season of its commercial exploitation, from December to June, the population is confined between the two anicuts. Some recruitment from outside this region takes place from October to December when juveniles of 10 to 30 mm move up the lower anicut (Ibrahim, 1962). The anicuts prevent any emigration of larger prawns during this period. During the period of commercial exploitation, the population is selfcontained, with its own recruitment sources. Tagging on a large scale should clarify the migrations of the species, showing whether the populations beyond and between the anicuts mix, and, if so, to what extent.
2.3 Review of life-history
Along the entire river stretch, maturation, spawning, fertilization and hatching of eggs all occur in fresh water, in the monsoon flood season. The breeding period extends from the end of June to the beginning of October, when the river is in full flood. At least two waves of larvae are released. The larvae are probably carried down river along with the flood-waters, when the waters below the lower anicut and even in the tidal limits are inundated with fresh water. The larvae probably grow here, and by October, when the last breeding is still taking place, they commence to return. Young prawns of 8 to 30 mm continue to re-enter the freshwater environment from October to January or February. It is not known at present whether the juveniles which move up the lower anicuts are the only source of recruitment. These juveniles suffer high mortality at the anicuts from intense harvesting and heavy predation by birds, and if they are the only source of recruitment, this mortality is likely to affect adversely the total stocks to a very great extent.
The average life span of the species is judged to be about 3 to 3½ yr in females and 4 to 4½ yr in males.
2.4 Types of fishery
All stages from small juveniles to the largest adults are fished heavily, and there are no fishery regulations on closed seasons or minimum sizes. The entire harvest is utilized for human consumption.
The commercial fishery is conducted by a number of professional fishermen operating combined units of shore seines with dragnets (jaruguvala), independant dragnets (kontevala), and castnets. The main gear used is the jaruguvala and the catch of this gear averages about 60 percent prawns and 40 percent fish (Fig. 2). About 70 percent of the total landings of prawn for the total area is landed by jaruguvala and 30 percent by miscellaneous minor gear. In the main fishing ground (sub-area I) 75 percent of prawn is landed by jaruguvala, and 25 percent by miscellaneous gear. In the sub-area II, jaruguvala is very rarely operated and the castnet is the only gear catching prawns, accounting for 75 percent of the landing of prawn of this sub-area. In the present paper estimates of the prawn population of the river, and of landings, trends and population indices are based on catches with jaruguvala. The castnet is not at all comparable to jaruguvala and no attempt is made to compare catches from the two nets.
2.5 Boats and gear
The boat used in jaruguvala operation is an ordinary country boat, 10 m long and of 3 ton capacity, manoeuverable by one man. Each jaruguvala unit is composed of 14 to 20 pieces, each piece of length 20 m, height 3 m, and with a uniform body mesh of 3.0 cm (note: the mesh is never absolutely uniform; a variation of 0.5 cm is quite common in these hand-woven nets). Along the bottom, the net is folded back for about 20 cm to form a pocket, and along this folded edge several beads (of burnt clay) are knotted at intervals of 5 to 8 cm. While in operation, one end of the net is left on shore and the remaining net is taken on the boat and payed out in a wide semi-circle before bringing the other end to shore (Fig. 3). The ‘shore’ can be any sand bank in the middle of the river or it may be the actual bank of the river. A float is attached to the middle of the net, which may be in water of 10 to 15 m before hauling commences. At the end of these operations, 4 to 6 men at each and commence dragging the net slowly in. After three quarters of the net is dragged on to the shore and the outer part is in rather more than 1 m of water, all the men except one at each and leave the main net and take up dragnets (mesh 1 cm, length 20 m, and height 1½ m). They surround the main net by spreading out in a semi-circle behind it (Fig. 4), then the dragnets are pulled along the bottom towards the shore, while the two men at each end of the jaruguvala pull it in simultaneously. All the ‘escape’ from the jaruguvala is thus caught in the dragnets. Each haul may last from 45 min to 3 h.
Fig. 2 Histogram depicting percentage composition of prawn (shown in black) in the total landings by jaruguvala in the sub-area I and season I, viz. January to June, in each year.
Routine jaruguvala operation is to fish the nets any time from 04:00 to 08:00 h, from 10:00 to 12:00 h or from 12:00 to 15:00 h. Fishing is never carried out between midnight and 04:00 h. The landing time usually corresponds to the market timings which are between 08:00 and 10:00 h and between 16:30 and 18:00 h.
The castnet is very common along the entire stretch of the river. It is operated by one man, mainly from the shore but sometimes from a boat. The castnet fisherman often uses lure or bait in the form of food balls (rice-bran + rice). Castnet fishing may be carried out at any time of the day or night.
2.6 Commercial fishery statistics
Statistics of net operation and prawn yield in the entire stretch were not maintained prior to 1963. The first attempt at a statistical survey of the riverine fishing areas and gear was made in 1959, and thereafter survey and inventory checks have been made at intervals of three to four years. Such checks were made in 1962 and again in 1965 to assess the changing distribution of gear along the river stretch.
2.6.1 Survey design In this type of riverine fishery, there is very little or no subsistence fishery. The survey design is as follows:
Survey assistants collect data on gear, landings, size-composition of landings (excepting those of prawn), area of net operation, duration of net operation and other relevant facts; they visit eleven fish landing centres at regular intervals. Each assistant covers approximately 60 km of river. These data are assembled in a proforma and passed on for further processing. The entire fishing area is marked off into subarea I and sub-area II based on the location and distribution of jaruguvala effort. Sub-area I is the main commercial prawn fishing region exploited by this gear and the annual catch averages more than 10 times that of sub-area II (Table I). This sub-area is further divided into four sub-sub-areas viz: Rajahmundry, Dowlaishwaram, Kovvur and Polavaram, delineated in Fig. 1. The same figure shows the total area in hectares and the areal weighting factor of each sub-sub-area. Sub-area II is divided into three sub-sub-areas, Bhadrachalam, Dummagudem and Kondamodalu; it is fished by castnet in all seasons, but landings are small.
2.6.2 Season Important seasonal differences in the fishery are confined to sub-area I. The main prawn fishing season (season I) commences in December of each year when one jaruguvala unit is put into operation. By January more units enter the fishery. Maximum effort and catch have usually been recorded for the months of April or May and sometimes in June. If the floods are delayed, one or two fishing units continue their operations till July. By mid-July, however, all jaruguvala operations cease. From July to December (season II) intermittent fishing by castnet takes place.
In the sub-area II, there is little difference in yield between the two seasons.
2.6.3 Effort and its distribution The effort is recorded by sampling at actual fishing areas. Landing sites are visited for two days in succession in a week, and information is also obtained from net owners. The regional distribution of various gear is facilitated by the division of the river stretch into various sub-sub-areas, as explained above.
The quantity of effort expended is calculated by estimating the number of times the units have operated multiplied by the average man-hours expended by each net unit.
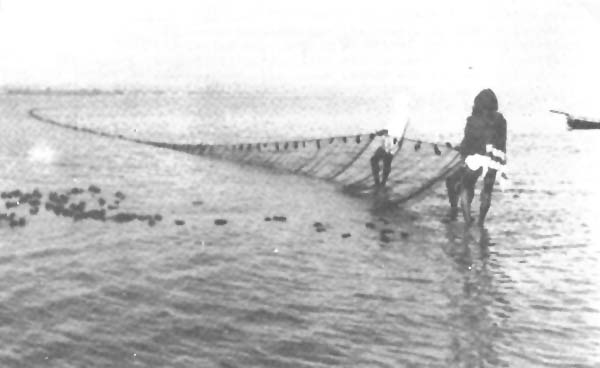
Fig. 3 Jaruguvala operation in the river: first stage when shore seine is paid out.
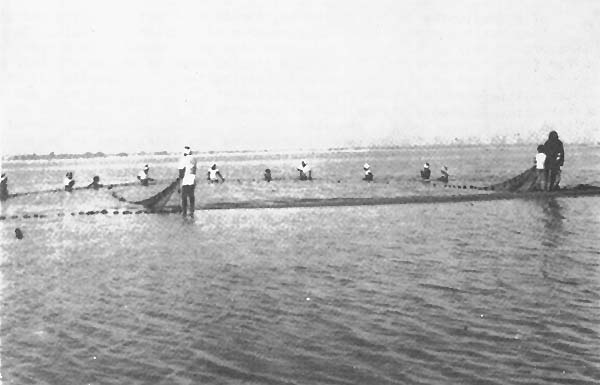
Fig. 4 Second stage of the jaruguvala operation. Main net at a distance of about 10 m from shore with drag-net (kontevala) spread out behind it. Fishermen at intervals, pressing net down and slowly dragging it towards shore.
TABLE I
Prawn catch in tons, taken by different gear in sub-area I and sub-area II Season I, January to June; Season II, July to December
| Year | Sub-area I, season I | Sub-area I, season II | Total sub-area I | Total sub-area II | Total sub-area I and sub-area II | |||||||
| Jaruguvala | Other gear | Total | Castnet | Other gear | Total | Castnet | Other gear | Total | ||||
| 1963 | Yield | 52.9 | 17.1 | 70.0 | 2.9 | 5.9 | 8.8 | 78.8 | 7.7 | 4.3 | 12.0 | 90.8 |
| % | 75.5 | 24.3 | 32.3 | 67.5 | 63.9 | 35.9 | ||||||
| 1964 | Yield | 81.3 | 20.2 | 101.5 | 2.1 | 0.6 | 2.7 | 104.2 | 4.6 | 0.9 | 5.5 | 109.7 |
| % | 80.0 | 19.8 | 78.1 | 21.9 | 83.1 | 16.9 | ||||||
| 1965 | Yield | 36.4 | 13.6 | 50.0 | 3.5 | 1.5 | 5.0 | 55.0 | 4.9 | 0.9 | 5.8 | 60.8 |
| % | 72.7 | 27.2 | 69.0 | 31.0 | 84.2 | 15.8 | ||||||
| 1966 | Yield | 43.6 | 12.8 | 56.4 | 2.8 | 7.5 | 10.3 | 66.7 | 4.4 | 0.5 | 4.9 | 71.6 |
| % | 77.3 | 22.7 | 27.6 | 72.4 | 89.2 | 10.8 | ||||||
| Total | Yield | 214.2 | 63.7 | 277.9 | 11.3 | 15.5 | 26.8 | 304.7 | 21.6 | 6.6 | 28.2 | 332.9 |
| % | 77.0 | 22.8 | 42.0 | 58.0 | 76.2 | 23.6 | ||||||
2.6.4 Landings Another important variable is the catch. The statistics of catch are obtained by sampling once a week at the fish landing centres. The direct landing of catches immediately after fishing facilitates recording precise weights of prawn landing. A major shortcoming in sampling is the difficulty of recording the size-composition of the landings.
Since the commercial utilization of prawn is only for human consumption and no other non-commercial fishery has been noticed in the area of study, it can be said that the sampling adequately covers the total prawn harvest of this region.
Prawn landing statistics are of ‘whole’ weights, and the practice of removing ‘heads’ is not seen anywhere in riverine prawn fisheries. The catches are consumed locally, in a fresh condition.
Total seasonal fishing effort in sub-area I by jaruguvala (Fig. 5) during the years 1963 to 1966 averaged 252.5 thousand man-hours, and was comparatively less in the years 1963 and 1966 than in 1964 and 1965 (Table II). Total prawn landings for sub-area I in season I fluctuated between 36 and 81 tons in different years.
TABLE II
Jaruguvala effort and deviation from mean in sub-area I, season I
| Year | In thousands of man-hours | % deviation from the mean | |
| 1963 | 244 | - 3.3 | |
| 1964 | 279 | + 10.5 | |
| 1965 | 274 | + 8.5 | |
| 1966 | 213 | - 15.7 | |
| Total | 1,010 | ||
| Mean | 252.5 | ||
Effort and catch data (Table III and Fig. 5) show the following trends. The sub-sub-areas Rajahmundry, Dowlaishwaram, Kovvur and Polavaram, in that order, ranked as top prawn producers. The distribution of effort within each sub-sub-area varied to a certain extent from month to month in each year. In Dowlaishwaram the effort was concentrated generally in the months of March to June. Nevertheless prawn fishing seems to have been entirely suspended in May and June 1966. These minor distributional differences, however, have not affected the total seasonal effort to any great extent except in 1966. Similar changes affected the catch also.
In Rajahmundry sub-sub-area, the greatest yield was taken in April, May or June in each year.
At Kovvur, during 1963 and 1964, no effort was expended from January to April. During 1965 and 1966, effort appeared to have shifted to this sub-sub-area from other regions, resulting in fishing operations from January onward.
At Polavaram, fishing usually commenced by late January and early February and varied considerably in intensity and yield.
TABLE III
Monthly estimated effort in man-hours (E) and catches (C) in kg by jaruguvala in each sub-sub-area in sub-area I for season I
| Sub-area and year | January | February | March | April | May | June | Total | ||
| I. | Dowlaishwaram | ||||||||
| 1963 | E | 2,176 | .. | 6,916 | 1,760 | 4,800 | 3,692 | 19,344 | |
| C | 189 | .. | 419 | 357 | 498 | 510 | 1,973 | ||
| 1964 | E | 2,160 | .. | 4,200 | 1,920 | 3,402 | 3,600 | 15,282 | |
| C | 206 | .. | 564 | 204 | 623 | 395 | 1,992 | ||
| 1965 | E | 7,410 | 1,531 | 5,400 | 3,680 | 1,680 | 1,080 | 20,781 | |
| C | 531 | 291 | 643 | 521 | 83 | 53 | 2,122 | ||
| 1966 | E | .. | 1,440 | 2,610 | 2,475 | .. | .. | 6,525 | |
| C | .. | 257 | 631 | 457 | .. | .. | 1,345 | ||
| II. | Rajahmundry | ||||||||
| 1963 | E | .. | 3,600 | 9,480 | 11,200 | 14,880 | 5,390 | 44,550 | |
| C | .. | 2,908 | 1,245 | 4,060 | 5,018 | 1,920 | 15,151 | ||
| 1964 | E | 6,720 | 6,480 | 11,392 | 11,914 | 11,700 | 8,240 | 56,446 | |
| C | 926 | 824 | 3,730 | 7,455 | 3,119 | 4,702 | 20,756 | ||
| 1965 | E | 4,632 | 6,178 | 9,231 | 4,530 | 7,905 | 5,400 | 37,876 | |
| C | 469 | 696 | 1,698 | 2,424 | 1,601 | 1,847 | 8,735 | ||
| 1966 | E | 4,620 | 6,806 | 5,640 | 9,052 | 4,953 | 7,560 | 38,631 | |
| C | 2,330 | 2,185 | 1,298 | 3,286 | 1,887 | 2,814 | 13,800 | ||
| III. | Kovvur | ||||||||
| 1963 | E | .. | 750 | .. | .. | 1,395 | .. | 2,145 | |
| C | .. | 50 | .. | .. | 83 | .. | 133 | ||
| 1964 | E | .. | .. | .. | 345 | 2,304 | 540 | 3,189 | |
| C | .. | .. | .. | 98 | 87 | 93 | 278 | ||
| 1965 | E | .. | .. | 6,293 | 4,625 | 2,400 | 1,860 | 15,178 | |
| C | .. | .. | 156 | 856 | 205 | 153 | 1,370 | ||
| 1966 | E | 2,160 | 1,968 | 3,388 | 2,112 | 1,050 | 760 | 11,438 | |
| C | 60 | 634 | 298 | 430 | 189 | 206 | 1,817 | ||
| IV. | Polavaram | ||||||||
| 1963 | E | .. | 2,400 | 1,176 | 3,540 | 3,660 | 1,800 | 12,576 | |
| C | .. | 92 | 27 | 61 | 199 | 82 | 461 | ||
| 1964 | E | .. | 2,160 | 4,140 | 4,800 | 3,150 | 2,660 | 16,910 | |
| C | .. | 213 | 791 | 911 | 749 | 340 | 3,004 | ||
| 1965 | E | .. | 2,100 | 2,490 | 4,380 | 3,600 | 3,285 | 15,855 | |
| C | .. | 150 | 254 | 800 | 370 | 238 | 1,812 | ||
| 1966 | E | 1,152 | 5,280 | 3,680 | 1,920 | 1,200 | 1,440 | 14,672 | |
| C | 233 | 988 | 499 | 459 | 416 | 216 | 2,811 | ||
Fig. 5 Histogram showing effort expenditure and total commercial yield by jaruguvala in sub-area I and in season I (January to June).
To study reaction of population to varying exploitation, suitable indices of population size must be obtained.
4.1 Fishable biomass index
Kutkuhn (1962) has defined the fishable biomass “as that fraction (in terms of weight) of a commercial population, which comprises those individuals vulnerable to capture with the gear commonly used by fishery”. The fishable population in the present instance refers to that above the lower limit retained by the jaruguvala with the ‘constant’ mesh used in the gear. This lower limit is 50 mm. No selection practices are followed for the size-groups taken, and there is no discarding of prawns of any size at fishing or landing sites.
The geographical limits of the present population are known (between the two anicuts at Dowlaishwaram and Dummagudem for 6 to 7 mo in a year) and the manner in which effort is deployed over this is also known from sampling of commercial gear at regular intervals. Kutkuhn (1962) mentioned that, if these two factors are known, an index to the true probability with which a standard unit of the fishable biomass will have been removed can be derived for each time increment. Weighted averages of all fishing intensities calculated for each sub-area within the range of population is the “effective overall fishing intensity” (f) (Beverton and Holt, 1957; Kutkuhn, 1962). Gulland (1955, 1956) used a similar method to obtain biomass indices.
The fishing effort per unit area is the fishing intensity in a sub-area; the weighting factors are corresponding biomass indices of the sub-area. “Since the ratio between catch (in weight) and effective overall fishing intensity is proportional to the fishable biomass, it follows that the fishing intensity is also proportional to the fishing mortality parameter, an important consideration in attempts to evaluate the latter” (Kutkuhn, 1962).
There are a few shortcomings in estimates which are associated mainly with the compilation of data by different persons. With experience this has been partly removed. Other bias comes from lack of uniformity of gear and conditions, which naturally results in variable catches, clogging of nets by algal masses, saturation of gear by miscellaneous fish, and patchy distribution.
The assumptions in regard to the operation and natural factors are:
that the water spread, from which the areal weighting factor is calculated, remained constant from year to year;
that the effects of different operational abilities of men partaking in seining and the gear efficiency remained relatively constant; and
that the dimensions of sampling error and bias, if any, remained constant for each time interval.
4.2 Computation
To show the method of computation, statistics of a sub-area are shown in Table IV, wherein commercial effort and M. malcolmsonii catches of one month (of May 1964) for each of the four unequal sub-sub-areas comprising sub-area I are included.
TABLE IV
Commercial statistics of prawn fishery in sub-area I of the River Godavary, May, 1964
| Statistical sub-sub-area | Area (ha) ai | Areal weighting factor wi | Total effort (man-hours) gi | Total catch (kg) yi | Total catch Total effort di |
| Dowlaishwaram | 380 | 0.0201 | 162 | 46.70 | 0.2882 |
| Rajahmundry | 8,495 | 0.4504 | 1,172 | 576.27 | 0.4916 |
| Kovvur | 6,385 | 0.3385 | 72 | 14.53 | 0.2018 |
| Polavaram | 3,600 | 0.1908 | 450 | 67.06 | 0.1490 |
| Area totals | 18,860 | 0.9988 | 1,856 | 704.56 | 0.3796 |
| ∑wi di = 0.329 = fishable biomass index for May, 1964 | |||||
Kutkuhn (1962) mentioned that if it is assumed that the biomass as manifested by the ratio of catch to effort (di) was constant within each of the i sub-sub-areas throughout the period indicated, then the best index of overall population biomass is the weighted mean catch-effort ratio for each sub-sub-area. Hence, the areal weighting factor (wi), is the proportion of the total occupied area represented by the ith sub-sub-area. The concepts of Gulland (1955, 1956), Beverton and Holt (1957), as given by Kutkuhn (1962) is shown in the notation:
where fi = gi/ai is the fishing intensity in the ith the sub-sub-area:
Yi/fi is the index of fishable biomass in ith sub-sub-area and other notations are shown in Table IV.
The wi di is also known as “catch per unit effective fishing intensity”.
This is to distinguish it from “simple catch per unit fishing effort” or catch-per-man-hour
in the present case, which would be obtained if the effort and catch statistics
were not available on a sub-area basis; then the biomass would be assumed to be uniformly
distributed throughout the area of commercial fishing operations. This would also
result in an overall population figure which would be much higher. If the catch/effort
ratio is used as biomass index, the great differences between successive time intervals
could as well be due to changes in effort distribution as to real changes in population
biomass.
wi di is also known as “catch per unit effective fishing intensity”.
This is to distinguish it from “simple catch per unit fishing effort” or catch-per-man-hour
in the present case, which would be obtained if the effort and catch statistics
were not available on a sub-area basis; then the biomass would be assumed to be uniformly
distributed throughout the area of commercial fishing operations. This would also
result in an overall population figure which would be much higher. If the catch/effort
ratio is used as biomass index, the great differences between successive time intervals
could as well be due to changes in effort distribution as to real changes in population
biomass.
Over the period 1963 to 1966, annual M. malcolmsonii production by all gear, in the entire area of investigation fluctuated around an average of 80 tons, thus representing about 30 percent of the total production of the region of all species of fish and prawns. These high fluctuations in landings shown in Table I indicate that there might be actual changes in the population structure from year to year.
The yield histograms drawn from monthly landings (Fig. 5) reveal that the peak production in the entire region was attained during the first half of each year, 90 percent of each calendar year's catch being made in that period. This pattern of seasonal concentration was common in both the sub-areas, I and II.
The length-frequency distribution of the population shows that the prawns assembling in late winter to early summer are comparatively large. As the season progresses through May and June smaller size-groups, recruits from the previous year's breeding, become dominant in the commercial fishery. The survivors of this group in July to September constitute the spawning population; the gonads mature during May and June, and the first berried females appear in early July. In July, the commercial seine fishery closes owing to the commencement of the floods in the river, and any further fishing is carried out only by cast-nets. There is therefore little commercial exploitation of the spawning population.
This spawning population has at least two heightened periods of spawning activity, during July and September, and produces at least two main broods and a number of minor broods during the protracted breeding period, from July to September or October.
Excessive harvesting of small prawns naturally reduces the yield of larger sizes. Unfortunately, calculation of the biomass of each brood or by size was impossible. This also precluded the study of the effect of varying fishing intensities on different growth stages. Ibrahim (1962) recorded the percentage distribution of each year class in the fishery as: 0 and 1-year class (up to 80 mm total length) 82 percent, 2-year class 16.5 percent and 3-year class 1.2 percent, amongst females; and 0 and 1-year class 85.2 percent, 2-year class 14.5 percent and 3-year class 1.4 percent, in males. Thus the bulk of the catch during 1960 and 1962 consisted of 0 and 1-year class. With slight variations in the percentage composition, this can be taken as the general trend of the age-group composition in the years 1963 to 1966 also.
5.1 Sub-area I
5.1.1 Season I
5.1.1.1 Yield and population characteristics: Through the years 1963 to 1966, the prawn yield in this sub-area and season averaged 83.4 percent of total prawn yield of the river. Jaruguvala landings for each year are given in Table I, and landings for each of the sub-sub-areas are shown in Table III.
Concentration of almost all size/age groups of the population in Rajahmundry provides the overall picture of the size structure in what may be considered as the central area of distribution of the stock. The rates of growth in terms of length and weight have been measured to a certain extent, though attempts at tracing seasonal growth rates or comparative growth rates from year to year remain to be completed. This aspect is therefore not discussed in detail. General assessment from field and laboratory studies shows that maximum growth in weight occurs in the ‘large’ prawns, of length 121 to 180 mm (carapace lengths 35 to 54 mm) and count 6 to 20 heads-on per lb (13 to 44 per kg). The average size in the commercial fishery in this sub-area is at lengths of 81 to 100 mm (carapace lengths 22 to 28 mm) and weight 30 to 60 per lb (66 to 132 per kg).
This concentration of all size groups at Rajahmundry and Dowlaishwaram is in the immediate vicinity of a recruitment area at Dowlaishwaram. The concentration diminishes towards Kovvur then increases slightly as one moves upstream to Polavaram. All the size-groups in the population are maturing by May and June. Almost 75 percent of males and 30 percent of females of medium and large sizes (100 to 170 mm) are mature.
5.1.1.2 Fishable biomass: Fig. 6 and Table V show the monthly biomass indices in each year. Each monthly index is a weighted mean (i.e., areal weightage) of the four sub-sub-areas, viz: Rajahmundry, Dowlaishwaram, Kovvur and Polavaram. The monthly index reaches a maximum in April, May or June each year and declines rapidly in July when jaruguvala operation ceases.
During 1964 the catch-effort indices in each month were generally high in each sub-sub-area (Table V). In this year, even by January the index of population biomass was high and continued to show improvement up to July. In 1965 on the other hand, the total biomass index was greatly reduced, particularly in the second half of the season. Slight recovery was indicated in 1966, especially in the months of April, May and June.
TABLE V
Monthly biomass indices (January - June) in sub-area I
| Month | 1963 | 1964 | 1965 | 1966 |
| January | 0.1947 | 0.1467 | 0.1419 | 0.1557 |
| February | 0.1950 | 0.2240 | 0.1893 | 0.1843 |
| March | 0.1636 | 0.2449 | 0.1311 | 0.1302 |
| April | 0.2017 | 0.5111 | 0.1322 | 0.1858 |
| May | 0.2047 | 0.3239 | 0.1728 | 0.2000 |
| June | 0.1587 | 0.4870 | 0.1948 | 0.2249 |
| Mean index | 0.1864 | 0.3229 | 0.1603 | 0.1801 |
5.1.2 Season II As stated, the catch of the six months of season (July to December) is mainly by castnet because of flood conditions in the river. In the post-flood period of November and December, only one unit of jaruguvala is fishing. The total landings of prawn averaged 8.7 percent of the annual catch. Total yield for this season was 8.8 tons in 1963, 2.7 tons in 1964, and increased to 5.0 tons in 1965, and 10.3 tons in 1966.
The biomass indices of jaruguvala and castnet are not comparable in this sub-area even though each gear relates to separate seasons. The castnet is not considered satisfactory gear for deriving total population figures, since it does not take all the size groups in the population. Any figures on fishable biomass are therefore not comparable with “fishable biomass” as defined earlier.
5.1.2.1 Population characteristics: In July, August and September, in all the sub-sub-areas, 75 percent of the catch consists of berried females or females which have already spawned and have developing ovaries. About 90 percent of all females over 40 mm total length have external eggs or well developed ovaries. The spawning is protracted and lasts from July to October, with peaks in July and September. This spawning population is the remnant of the commercial fishery of season I.
Fig. 6 (A) Fishable biomass indices of each month in the years 1963 to 1966 in the sub-area I, season I.
(B) Trend over the four years.
Failure of the floods has a deleterious effect on survival of broods. If the contention that the larvae need to reach the estuary for further development and growth is correct (Ibrahim, 1962; Anon., 1965), then this is a further factor causing fluctuations in the commercial fishery. The delay in occurrence of floods in July or their early cessation in October would probably retain the early-spawned and late-spawned larvae in the stretch between the anicuts and would result in high mortality.
Delay in floods also allows jaruguvala fishing to continue up to the middle of July, thereby reducing the residual spawning population.
During season II there is intense recruitment of juveniles (10 to 20 mm) during October to January or February, at the anicuts in Dowlaishwaram sub-sub-area (Ibrahim, 1962). The juvenile mortality is quite appreciable before recruitment to the commercial fishery because of harvesting of this size group for marketing. Waves of juveniles move up the anicut during these four months. The intensity of occurrence varies with flow of water over the anicut, which is only one of the several reasons for this variation. Observations show that very low night temperatures also adversely affect it. There are about 5,000 of these juveniles per kg. About 40 kg are caught in four hours of collection each night in the peak period (Rajyalakshmi, 1968).
How far these factors affect the commercial population and whether these activities should be controlled is yet to be assessed. However, this intense harvesting prior to recruitment might be partly responsible for the high fluctuations in the yields.
5.2 Sub-area II
5.2.1 Fishable biomass Prawn fishing in sub-area II is by castnet, the total catch representing 8.4 percent of the yield of the total river stretch. Annual yields for 1963 to 1966 are shown in Table I. During 1965 the prawn season extended from January to August, while in all the other years the season was from January to June or to the middle of July. Commercial concentrations in this sub-area are in Dummagudem and in its adjacent sub-sub-area, Bhadrachalam. From Bhadrachalam to the next sub-sub-area, Kondamodalu, it is almost a non-productive zone as far as prawn yield is concerned. Landings are composed predominantly of medium and larger sized prawns. Medium sizes are 20 to 60 heads-on per lb (44 to 132 per kg), total length 81 to 120 mm, carapace lengths 22 to 34 mm; large prawns are 6 to 20 heads-on per lb (13 to 44 per kg), total length 121 to 180 mm, carapace lengths 35 to 54 mm. The landings are therefore representative of the larger sizes and do not give a figure of fishable biomass comparable with that obtained from jaruguvala landings.
In this sub-area, the highest biomass indices fall during the months of maximum yield, March to June each year. The yearly maxima were 0.1750 in April 1963, 0.2564 in March 1964, 0.1584 in April 1965 and 0.1037 in April 1966. This seasonal predominance corresponds to season I of sub-area I.
5.2.2 Population characteristics The information on this aspect is rather incomplete, due to the selectivity of the gear. Large prawns predominate in the catches at all times. The breeding period, with two periods of heightened spawning activity, corresponds to that of sub-area I. The effects on survival of larvae by the delayed floods would also be similar.
Beverton, R.J.H. and S.J. Holt, 1957 On the dynamics of exploited fish populations. Fishery Invest., Lond. (2), 19:1–533
Gulland, J.A., 1955 Estimation of growth and mortality in commercial fish populations. Fishery Invest., Lond. (2), 18 (9): 1–46
Gulland, J.A., 1956 On the fishing effort in English demersal fisheries. Fishery Invest., Lond. (2), 20(5):1–41
Ibrahim, K. H., 1962 Observations on the fishery and biology of the freshwater prawn Macrobrachium malcolmsonii Milne Edwards of River Godavary. Indian J. Fish., 9(2):433–87
Kutkuhn, J. A., 1962 Gulf of Mexico commercial shrimp populations - Trends and characteristics, 1956–59. Fishery Bull.Fish Wildl.Serv.U.S., 62(212):343–402
Rajyalakshmi, T., 1968 Try prawn in tanks and in inland waters. Indian Fmg. Nov: 37–43
Anon., 1965 Q. Rep.cent.Inst.Fish.Res.Inst., Barrackpore, September
Acknowledgements
Thanks are first due to the Director, Dr. V.G. Jhingran, Ph. D., whose encouragement and guidance helped us to carry out the work and to prepare this paper. Our thanks are also due to Mr. H.P.C. Shetty, Senior Research Officer, for his help with the sampling program and with the manuscript, and to all Survey Assistants of the Unit without whose cooperation these data could not have been obtained.
![]()
![]()
![]()