Kai Lorenzen
Marine Resources Assessment Group Ltd.
8 Princes Gardens, London SW7 1NA, U.K.
Summary of a presentation at the 1st AADCP Workshop on:
Types of lakes and reservoirs and the ecological constraints on the enhancement of their fish production.
Melaka, Malaysia, 18–22 October 1993
ABSTRACT
Exploited fish stocks in Asian reservoirs are often partly or entirely maintained by stocking. Such culture-based fisheries pose assessment and management problems which are difficult to address using established methodology for natural stocks.
A population dynamics model for culture-based fisheries in perennial reservoirs is presented. The model incorporates explicit sub-models for the key biological processes to be considered in a culture-based fishery: density-dependent growth, and size-dependent mortality.
The dynamics of culture-based fisheries are explored, with particular reference to the interaction between the size of seed fish, stocking density and optimal harvesting. The estimation of model parameters from stocking and catch data is discussed, and an adaptive approach to the management of culture-based fisheries is outlined.
1 INTRODUCTION
This paper gives a brief overview of the population dynamics of culture-based fisheries. At first, models for the population processes of density-dependent growth and size-dependent mortality are introduced. These process models are then combined in a length-structured population model. The population model is used to explore the dynamics of culture-based fisheries. Finally, the potential use of this model in practical assessment and management is outlined.
2 POPULATION PROCESSES
Density-dependent growth and size-dependent mortality are the key population processes in a culture-based fishery. The understanding and quantitative description of these processes is crucial to the rational management of culture-based fisheries.
2.1 Density-dependent growth
Density-dependent growth is the result of intraspecific competition, mainly competition for food. The following model for density-dependent growth is adapted from a model proposed by Beverton & Holt (1957).
The model is based on the von Bertalanffy growth function. In the VBGF, the growth rate K is related to katabolism (the breakdown of body materials), while the infinite length or weight (L∞ or W∞) is related to anabolism (the building up of body materials). Hence L∞ is expected to be dependent on food consumption, while K is expected to be independent of food consumption. In order to model density-dependent growth, L∞ is expressed as a linear function of population biomass. The resulting growth model is:

| where | L: | length |
| B: | Population biomass density | |
| K: | von Bertalanffy K | |
| L∞: | limiting L∞ | |
| d: | competition coefficient |
The parameter L∞L is specific to the population, it reflects the productivity of the water body. The competition coefficient d is a measure of the intensity of competition within the population, it is dependent on population structure.
The model rests on the assumption that population biomass is a good measure of competition and its effect on individual growth. The model is discussed and tested further in Lorenzen (1993).
2.2 Size-dependent mortality
Empirical studies of the relationship between mortality and body mass (Peterson & Wroblewski 1984, McGurk 1986) have shown that the mortality rate can be described as a power function of body mass:

| where | Mw: | mortality rate at body mass W |
| W: | body mass | |
 | exponent of the mortality-size relationship | |
| Mr: | mortality rate at reference weight | |
| Wr: | reference weight |
Peterson & Wroblewski (1984) found  =0.25 for fishes in the marine pelagic
ecosystem, while McGurk (1987) found
  =0.44. Gulland (1987) proposed the use
of
  =0.5 as a “guesstimate” in fish stock assessments if no specific information
is available.
Fig. 1 shows the mortality-size relationship for common carp in European
pond culture. The straight line indicates  =0.5.
=0.5.
3 A LENGTH-STRUCTURED POPULATION MODEL
The process models for density-dependent growth and size-dependent mortality are combined in a length-structured population model as illustrated in Fig. 2.
The fish population is divided into length classes, so that the population at time t is represented by a vector of numbers-at-length. The population model projects this vector to the next time t + 1, and it also calculates a catch vector, giving the numbers caught in each length group during the time interval from t to t + 1.
Mathematically, the model is expressed in the following two matrix equations:
| nt+1 | = | GB St (nt + stt) |
| Ct | = | GB Ht (nt + stt) |
| where | n: | population vector |
| c: | catch vector | |
| st: | stocking vector | |
| GB: | density-dependent growth projection matrix | |
| S: | survival matrix | |
| H: | harvesting matrix |
Lorenzen (1993) discusses in more detail the model and the construction of the matrices. The population model is similar to that introduced in Sullivan et al. (1990), with a deterministic growth projection matrix as proposed by Shepherd (1987).
The projection matrix model is most general in that it allows the simulation of any possible stocking and harvesting pattern. The model can be fitted to stocking and catch-at-length data, in order to estimate parameters.
4 DYNAMICS OF CULTURE-BASED RESERVOIR FISHERIES
The dynamics of culture-based fisheries in perennial reservoirs are explored using the model introduced above.
The following parameter values are used in all simulations:
| Length-weight relationship | a | = | 2.5 × 10⁻⁵ kg/cm3 |
| b | = | 3.0 | |
| Density-dependent VBGF | K | = | 0.5 y-1 |
| L∞L | = | 100 cm | |
| d | = | 0.5 cm ha kg-1 | |
| Mortality |  | = | 0.5 |
| Mr | = | 1.3 y-1 | |
| Wr | = | 0.2 kg |
Stocking is assumed to be continuous and constant during the year, so that the population is at dynamic equilibrium and shows a stable length structure. The length of seed fish is normally distributed with a standard deviation of 1 cm. Knifeedge selection at length lc is assumed, i.e. all fish larger than lc are subject to 100% selection by fishing gear, while all smaller fish escape the fishing gear. Fishing mortality is very high, so that all fish are harvested immediately after reaching the selection length.
Various aspects of the dynamics of a culture-based fishery are explored in the following sections.
4.1 Stocking density
The influence of stocking density on production, population biomass density, and age at harvesting is shown in Fig. 3, for constant mean length of seed fish and gear selection length.
Biomass stocked always increases in proportion to the stocking density in numbers. The biomass harvested also increases proportionally at low densities, but the rate of increase declines as stocking density is increased further. This reflects the density-dependent reduction in individual growth. At very high stocking density, the biomass harvested declines again due to stunting and consequent high mortality.
Production is the difference between biomass harvested and biomass stocked. Maximal production is reached where the slope of the “biomass harvested” curve equals the slope of the “biomass stocked” curve, i.e. at a lower stocking density than maximal biomass.
The population biomass density present in the reservoir at any instant of time increases in proportion to stocking density for the range of densities explored. The maximal production is reached at a biomass of 67 kg/ha.
The age at harvesting is defined as the time a fish needs to grow from the stocking size to the gear selection length. Age at harvesting increases with stocking density, because the individual growth rate decreases in response to population biomass density. The relative survival of fish decreases with increasing stocking density, because the fish need more time to grow, and are consequently subject to a higher cumulative mortality.
4.2 Size at harvesting
The optimal stocking density in a culture-based fishery is dependent on the size at which fish are harvested. Fig. 4 shows production as a function of stocking density for various gear selection lengths lc. The lower the gear selection length, the higher is the potential (maximal) production, and the higher is the optimal stocking density.
These results have a number of implications:
The highest total production is reached when fish are harvested at a small size. A demand for large fish limits the production potential of culture-based fisheries.
If the availability of seed fish is limited, fish should be harvested at a large size to attain maximal production. Conversely, if seed fish are stocked at a high density, they should be harvested at a small size to prevent overstocking (with consequent stunting and high mortality).
If large fish are to be produced, stocking densities must be low, overstocking occurs easily and must be avoided.
If fishing effort is low, fish are harvested at a large average size even when the gear selection length is low. This situation is in effect the same as harvesting at a high selection length with high fishing effort. Consequently, overstocking occurs easily if fishing effort is low.
Overfishing in a culture-based fishery can be averted by a decrease in fishing effort, or by an increase in stocking density.
In a developing culture-based fishery, increases in stocking density and fishing effort should go hand in hand.
Maximal production, optimal stocking density, and the corresponding age at harvesting and survival are shown as a function of gear selection length in Fig. 5.
4.3 Size of seed fish
The size of seed fish is a critical factor in a culture-based fishery. Fig. 6 shows production as a function of stocking density in numbers (A), and stocked biomass (B), for different sizes of seed fish. Different sizes of seed fish can yield a similar maximal production. There is however, a slight decrease of maximal production with increasing size of seed fish.
The larger the seed fish, the lower is the optimal stocking density in numbers (A). The picture for stocked biomass density (B) is quite different. The larger the fingerlings, the higher the biomass that needs to be stocked for maximal production.
In relative terms, production is more sensitive to stocking density (both in numbers and in biomass) for larger seed fish. Hence large seed fish will yield a good production only if stocked at precisely the right density. This is less critical for small seed fish.
Fig. 7 summarizes the results on optimal stocking as shown in Fig. 6, and gives some additional information. Note in particular the influence of seed fish size on survival. Although the survival of 3cm seed fish is ten times lower than that of 11cm seed fish, the small fish still achieve the highest production.
These results have several implications:
Different sizes of seed fish can be stocked to obtain a roughly similar level of production. The highest level of production can be achieved using small seed fish.
The larger the seed fish, the lower is the optimal stocking density in numbers. However, the decrease in optimal stocking density does not compensate for the high individual weight of large seed fish. Hence the optimal stocking biomass density increases sharply with the size of seed fish.
The production obtained from large seed fish is particularly sensitive to stocking density. Hence large seed fish will only yield a good production if the optimal stocking density can be determined precisely. The production obtained from small seed fish is less sensitive to stocking density.
The highest production can be obtained using small seed fish, despite their very low survival. Survival alone is a poor indicator of the performance of a culture-based fishery.
In Lorenzen (1993), the model predictions are combined with information on the cost of seed fish in relation to size, and revenue from the sale of produce. This indicates that maximal profit is often obtained at an intermediate size of seed fish.
5 ASSESSMENT AND MANAGEMENT
The model can be used to give quantitative predictions of the effects of management measures (e.g. changes in stocking density, the size of seed fish, or fishing effort), provided that the parameters can be estimated.
5.1 Parameter estimation
While some parameter values can be inferred from information external to the particular fishery to be assessed, other parameters need to be estimated for each particular fishery.
The parameter K in the density-dependent VBGF is the same as in the standard VBGF, it can be inferred from empirical models. The parameters L∞L and d need to be estimated for each fishery separately, and this requires some variation in biomass density.
In the mortality-size relationship,  can probably be inferred from empirical
models, while Mr needs to be estimated for each fishery separately.
All parameters used in the model can be estimated from stocking and catch data, provided that there is some variation in the biomass density and the size of seed fish. Marking of seed fish is potentially valuable to improve estimates in a perennial fishery.
5.2 Adaptive management
Adaptive management (Walters 1986) entails an experimental approach to stocking and harvesting, with the aim to improve parameter estimates and thus to find the optimal management policy for the fishery.
REFERENCES
Beverton, R.J.H. & Holt, S.J. 1957. On the Dynamics of Exploited Fish Populations. Fish. Invest. Ser. II, Vol. 19, 553pp.
Gulland, J.G. 1987. Natural mortality and size. Mar. Ecol. Progr. Ser. 39: 197–199.
Lorenzen, K. 1993. Assessment and Management of South Asian Small Reservoir Fisheries: A Population Dynamics Approach. Report, MRAG Ltd., 120pp.
McGurk, M.D. 1986. Natural mortality of marine pelagic fish eggs and larvae: the role of spatial patchiness. Mar. Ecol. Progr. Ser. 34: 227–242.
McGurk, M.D. 1987. Natural mortality and spatial patchiness: a reply to Gulland. Mar. Ecol. Progr. Ser. 39: 201–206.
Peterson, I. & Wroblewski, J.S. 1984. Mortality rate of fishes in the pelagic ecosystem. Can. J. Fish. Aquat. Sci. 41: 1117–1120.
Shepherd, J.G. 1987. Towards a method for short-term forecasting of catch rates based on length compositions. In: Pauly, D. & Morgan, G.P. (Eds.) Length-Based Methods in Fisheries Research. Manila: ICLARM. pp. 113–120.
Sullivan, P.J., Lai, H.L. & Gallucci, V.F. 1990. A catch-at-length analysis that incorporates a stochastic model of growth. Can. J. Fish. Aquat. Sci. 47: 184–198.
Walters, C.J. 1986. Adaptive Management of Renewable Resources. New York: Macmillan. 374 pp.
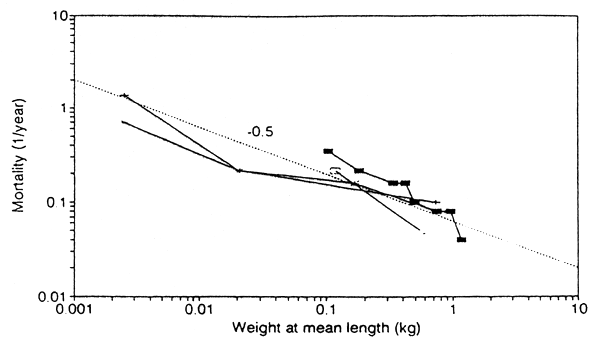
Fig. 1. Mortality rates in the pond culture of common carp, in relation to weight at mean length during the growth period. The straight line indicates a slope of -0.5. Mortality rates have been calculated from information given in various textbooks of pond culture.
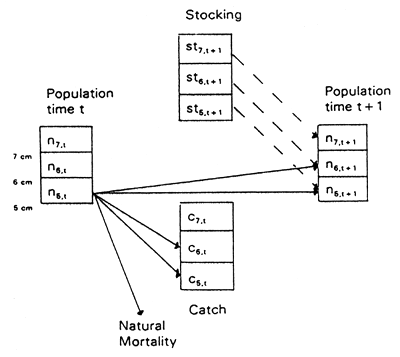
Fig. 2. Schematic representation of the length-structured population model.
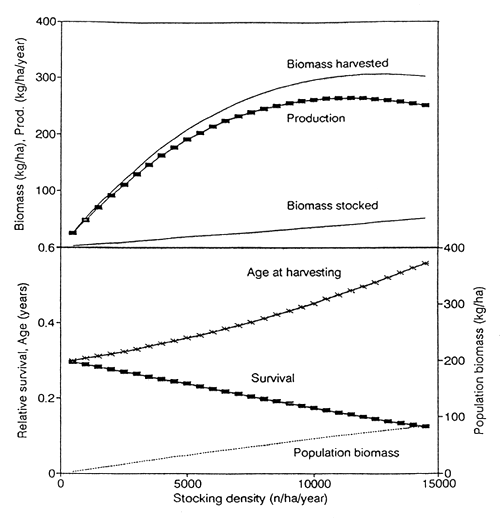
Fig. 3. Influence of stocking density on various aspects of production, for a constant mean length of seed fish (5 cm), and a constant gear selection length lc (18 cm). Standard parameter values.
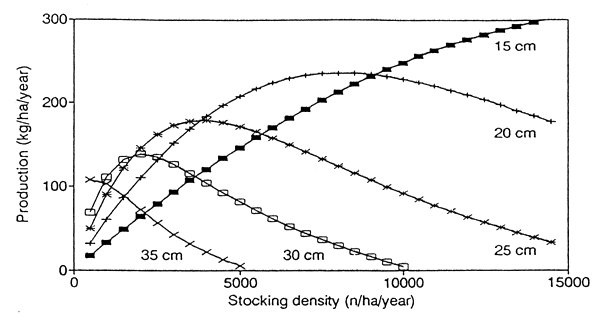
Fig. 4. Production as a function of stocking density, for various gear selection lengths. Labels indicate gear selection length lc. Mean length of seed fish 5 cm, standard parameter values.
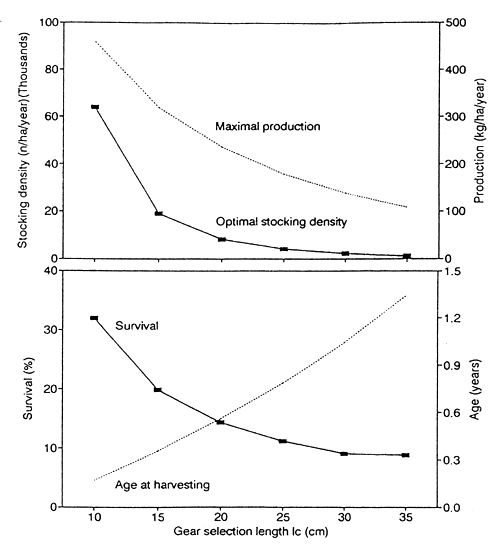
Fig. 5. Optimal stocking in relation to size at harvesting. (A) Maximal production and optimal stocking density (the density at which maximal production is achieved). (B) Relative survival and age at harvesting.
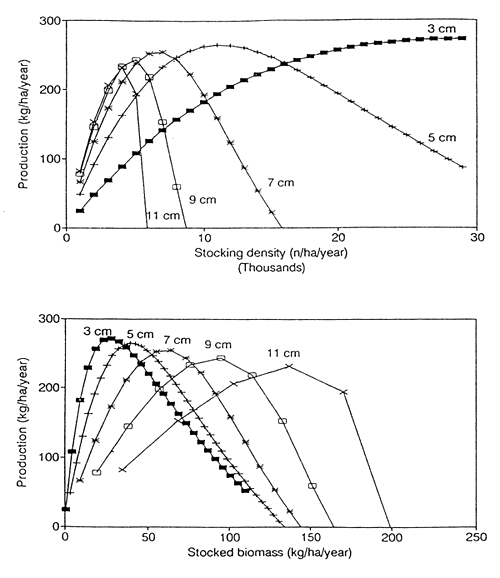
Fig. 6. Influence of the size of seed fish on production. Labels indicate the mean lengths of seed fish. (A) Production as a function of stocking density (numbers), for seed fish of different size. (B) Production as a function of stocked biomass density, for seed fish of different size.
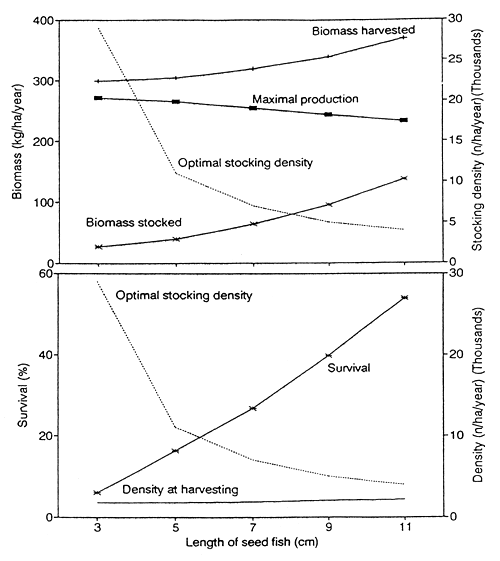
Fig. 7. Optimal stocking for different sizes of seed fish. (A) Maximal production, the corresponding optimal stocking density, and biomass density stocked and harvested in relation to the mean length of seed fish. (B) Optimal stocking density, density at harvesting, and relative survival in relation to the mean length of seed fish.