![]()
![]()
This report is an extension of an earlier investigation entitled “A Strategic Assessment of the Potential for Freshwater Fish Farming in Latin America” (Kapetsky and Nath, 1997). It was intended to include the Caribbean Island states in the original study. However, the necessary data on precipitation were not available at the time. Since the Latin America study was completed, the data became available and Caribbean extension of the study was undertaken.
Freshwater fish production from the Caribbean Island States was modest in 1996 (Fishery Information, Data and Statistics Unit, 1998), amounting to about 33,500 mt of which Cuba accounted for 83% consisting almost entirely of silver carp and tilapias. Jamaica produced about 3000 mt, nearly all tilapias. The Dominican Republic produced nearly 400 mt of which tilapias, common carp and giant river prawn were the most important. Freshwater fish farming output is on the increase in Cuba and Jamaica, but has decreased markedly in recent years in the Dominican Republic. Freshwater production among the other island states is relatively insignificant.
Overview
The potential for inland fish farming among the Caribbean Island States is based on methods used in an earlier study to estimate freshwater fish farming potential in Latin America. Four criteria were used to estimate potential for small-scale fish farming in ponds: water loss, potential for farm gate sales, soil and terrain suitability for ponds and availability of agriculture by-products as feed or fertilizer inputs. A fifth criterion was added in order to estimate potential for commercial fish farming: urban market potential. These criteria were weighted in different ways on the basis of expert opinion to make small-scale and commercial fish farming models. Numbers of crops per year of Nile tilapia and common carp were predicted based on monthly climatic variables. By varying feeding levels and harvest sizes small-scale and commercial level outputs were simulated. Combining the small-scale and commercial models with the simulations of fish production provided overall suitability ratings for each 5 are minute grid (approximately 9 × 9 km). Field verifications were carried out in Jamaica and the Dominican Republic.
Data and Analyses
All of the data and analyses for the present study were the same as those described by Kapetsky and Nath (1997), except those for precipitation. Readers are referred to that publication for the details.
Monthly precipitation data were acquired from Jones (1997) as interpolated images at 10 are minute resolution. The interpolation process was inverse square distance weighting to the nearest 5 climate stations with lapse rate correction to the NOAA TGP0006 10 minute grid elevation model.
Verification
Field verifications were carried out in Jamaica and in the Dominican Republic by one or both of the authors with the participation of informed experts to aid the selection of farms and to assist with interviews. A GPS receiver was used to establish locations.
Jamaica
An earlier study by Chakalall and Noriega-Curtis (1992) was used to select the parishes in which to work, namely those with most tilapia farming activity, in order to maximize the number of sites visited in the short time available for the exercise. Also, the earlier study indicated that larger-size commercial farms predominated in output and were the most common. Therefore, emphasis was placed on selecting commercial farms for the site verifications. The sites actually visited were determined by prior knowledge of the Head of the Fisheries Division who participated in the field work and by availability of the owner or managerial staff for interviews. In all, 21 sites were visited.
Dominican Republic
In the Dominican Republic the locations of 11 sites were acquired by GPS and interviews were conducted at 12 sites. The sites visited were selected with the help of a national aquaculture consultant. It should be mentioned that a number of farms were out of production at the time due to a variety of reasons.
Analyses
The locations of the farms were used to query the GIS to obtain the predicted suitability for small scale and commercial fish farming and the predicted number of crops per year of Nile tilapia and carp corresponding to the sites.
Maps and Histograms
The results for each criterion are presented in two ways. There is a map and a histogram for each. The map shows the spatial distribution of four categories of suitability:
Very suitable (VS)
Suitable (S)
Moderately suitable (MS)
Unsuitable (U)
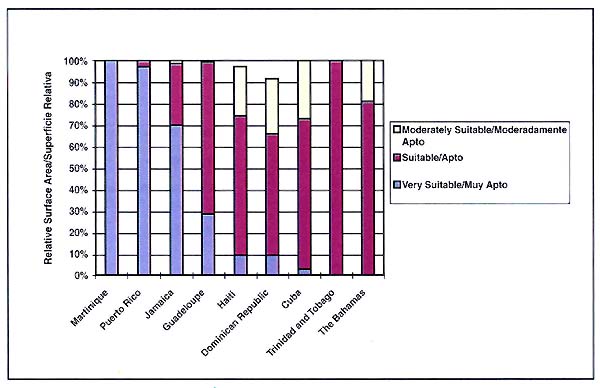
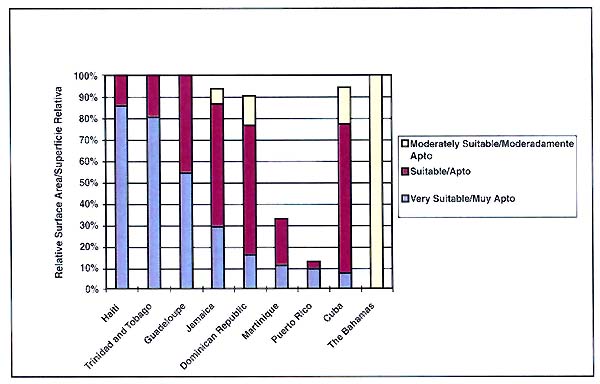
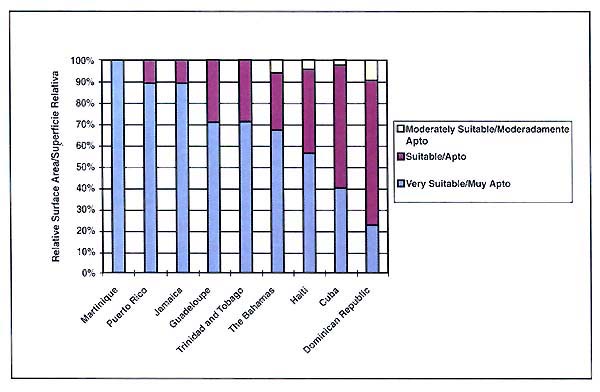
The histogram shows the relative amount of surface area in each country corresponding to each category of suitability. For simplicity, only the first three categories are shown: VS, S and MS.
Farming System Criteria
• Market size and proximity
Market size and proximity are based on population density at urban centres and estimated travel time along roads to reach urban markets.
Because the population of most of the countries among the Caribbean Island States is relatively dense and because there are many urban centres in close proximity to one another and to the surrounding country side, nearly all of the countries and all of their areas score VS (Fig. 1).
• Water loss from ponds by evaporation and seepage
Annual water loss is estimated from precipitation over the pond and its embankments, evaporation is from the pond surface and seepage is assumed to be a constant. This factor would underestimate water balance in a reservoir that might be used to feed a number of ponds because the runoff from the catchment area is not included.
Many of the countries score high in this category meaning that rainfall compensates for losses through evaporation and seepage (Fig. 2).
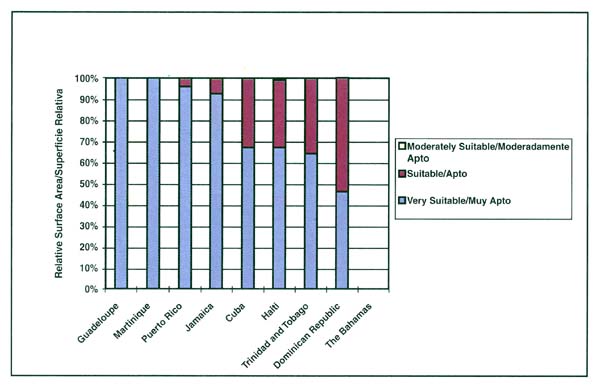
• Soil and terrain suitability for ponds
This criterion takes into account physical properties of soils as well as the character of the terrain that affect engineering suitability for ponds and chemical properties that affect aquatic productivity. Much of the Caribbean Island States area rates S, or MS and there is relatively little area that is either VS or U (Fig. 3)
• Potential for agriculture by-products
Agriculture by-products can be important inputs for fish farming either as fertilizers or feeds and they are more important for small-scale fish farming than for commercial farming. The model predicts the availability of agricultural by-products on the basis of crop potential.
Few countries have significant areas that rate VS in this category; however, most countries do have large areas that rate S or MS (Fig. 4).
• Farm gate sales
This criterion depends on population density local to the farm site (within the same grid cell of approximately 9×9 km), but does not take into account purchasing power or disposable income. A number of countries score either VS or S (Fig. 5).
Farming System Criteria Combined
• Small-scale model
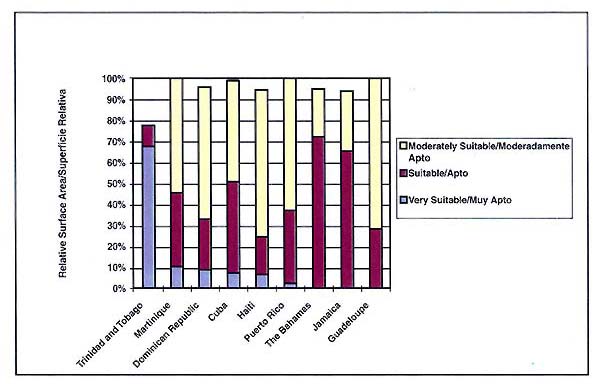
Combining the criteria weighted by their relative importance --annual water loss (51%), potential for agriculture by-products (19%), soil and terrain suitability (16%), and farm gate sales (14%)--produces a map of suitability for small-scale fish farming. Overall, most countries rate VS or S (Fig. 6). This outcome is strongly influenced by the relatively heavy weight placed on annual water loss.
• Commercial model
Combining the criteria weighted by their relative importance --market size and proximity (49%), annual water loss (27%), soil and terrain suitability (13%), farm gate sales (6%) and potential for agriculture by-products (5%),--produces a map of suitability for commercial fish farming. Overall, most countries rate mainly VS, or S (Fig. 7). This outcome is strongly influenced by the relatively heavy weights placed on market size and proximity and annual water loss.
• Fish Yield Models
Fish yield is based on models that predict monthly water temperatures and climatic conditions with food levels and harvest weights held constant.
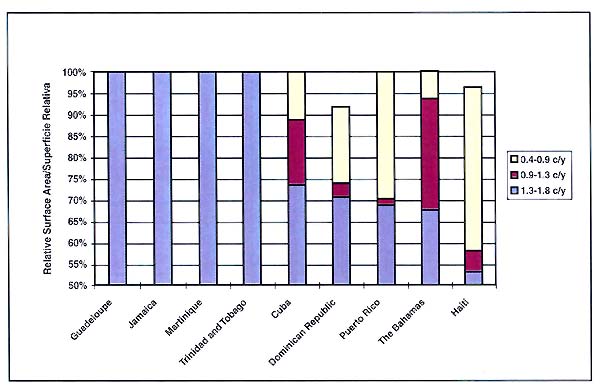
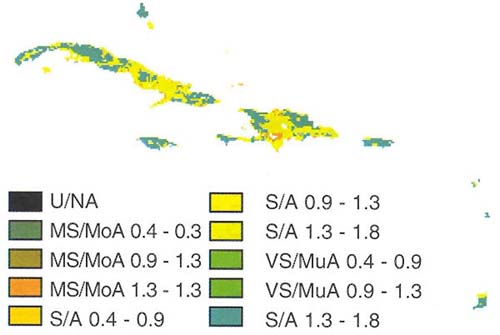
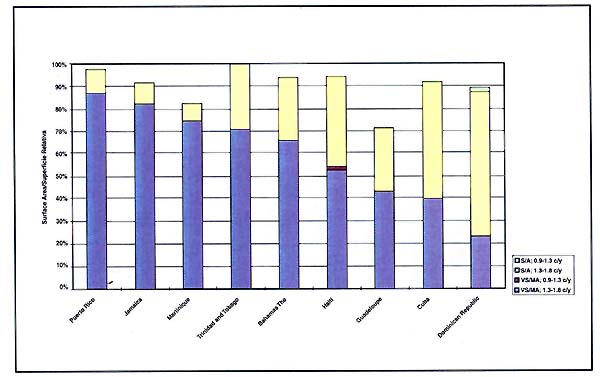
At small-scale levels with minimum food levels and harvesting at 150 g, much of the Caribbean Island States area could produce from 1.3 to 1.7 crops/y of Nile tilapia (Fig. 8) Similarly, from 1.3 to 1.8 crops/y of carp could be produced, if harvested at 350g (Fig. 9).
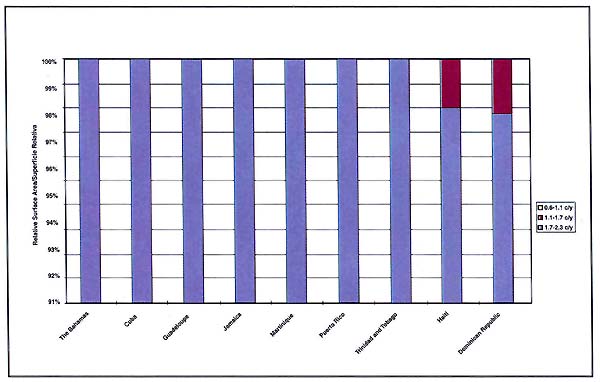
At commercial levels of inputs and harvesting at 300 g, much of the Caribbean Island States area could produce from 1.8 to 2.4 crops/y of Nile tilapia (Fig. 10). Similarly, from 1.7 to 2.3 crops/y of carp could be produced, if harvested at 600g (Fig. 11).
Fish Farming Potential with Fish Yield Models and Small-Scale Models Combined
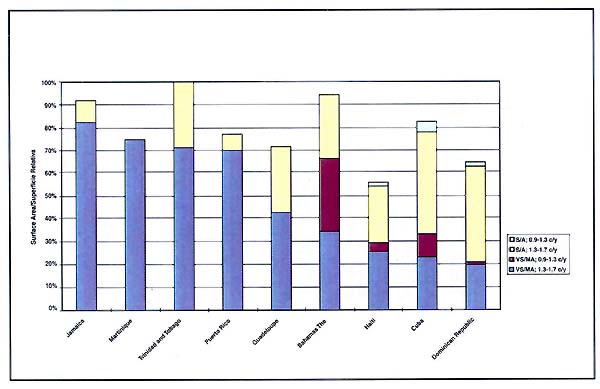
Combining the two kinds of models suggests that relatively high yields of Nile tilapia (Fig. 12) and carp (Fig. 13) could be obtained over relatively large areas of most countries where small-scale farming system conditions rate VS or S.
Fish Farming Potential with Fish Yield Models and Commercial Models Combined
Combining the two kinds of models suggests that relatively high yields of carp (Fig. 14) and Nile tilapia (Fig. 15) could be obtained over relatively large areas of most countries in the same locations where commercial farming system conditions rate VS or S.
Verification
Jamaica
• Urban market demand
Outcomes of the commercial model are heavily weighted by the factor “urban market demand”. Because the population of the Caribbean Island States is relatively dense, virtually all areas of all of the countries scored VS. Therefore, it is necessary to look closely at the other factors in order to better assess the predictions against the reality.
• Water temperature and growth
The growth model for tilapia predicts the maximum numbers of crops/y from commercial farms, from 1.8 to 2.4 at a harvest weight of 300 g, for all areas with the exception of small portions in the south of Haiti and the east of Dominican Republic.
In fact, in Jamaica commercially farmed tilapia are usually harvested at weights exceeding 300 g and the usual number of crops/y ranges from 1 to 3 (Fig. 16).
Water temperature records acquired from early morning observations in commercial ponds at Aquaculture Jamaica Ltd. in the southwest, (the farm is located in St. Elizabeth Parish) substantiate that temperature regimes favour high growth rates, as predicted. These records indicated occasional minima of 22° and 23° from August to January and 23° and 24° from April to August (Fig. 17).
• Water availability
The model predicts water availability based on gains through precipitation and losses through evaporation and seepage. This criterion does not apply well in Jamaica because fish farmers, in most cases, depend on water that is distributed for crop irrigation and for which there is a charge, or is obtained from deep wells, rivers or springs.
Water, however, is limiting because of its unavailability, or cost. Seven of 17 farms had problems of water availability either because of the drought at the time of the verification, or because of cost of purchase. Where water was being taken from a river or stream, pumping costs were mentioned as a constraint. There were 5 farms in which water was not mentioned as a constraint.
• Soil and Terrain Suitability
In Jamaica, four out of 21 sites were predicted to be MS for soil and terrain suitability and the remainder were predicted to be S. Of the four that rated MS, two were on flat areas, but in close proximity to steep hills and this probably influenced the outcome. At another site predicted to be MS, high seepage rates from some ponds were a serious problem. In the event neither soil quality nor terrain appeared to be limiting to the other sites visited that rated S.
• Agriculture by-products as inputs
The model predicts the availability of agriculture by-products on the basis of crop potential.
In Jamaica inorganic fertilizer is used to stimulate plankton production, but fish farmers utilize commercially formulated feeds, if they feed at all.
Therefore, this criterion does not apply well to the commercial farming situation in Jamaica.
• Farm gate sales
The model predicts potential for farm gate sales as a function of population density in close proximity to the farm.
Information about farm gate sales was obtained from 12 farms. At one-half of them such marketing was not practiced, or insignificant (≤5%). Many of the commercial farms raise tilapia on contract. Therefore, the market is guaranteed and farm gate sales are unimportant.
Of the remaining 6, three farms depended entirely on farm gate sales and farm gate sales were predicted to be VS at 2 of them, but US at the other. Two other farms marketed one-half of their production in this way and at one of these sites the farm gate sales potential was predicted to be VS and US at the other. The location of one farm that sold from 15–20% of its production in this way was predicted to be US.
The proximity and condition of roads as well as competition obviously play an important role in success with farm gate sales as does the capability to market when fish are seasonally in greater demand (e.g., Easter).
Dominican Republic
• Overview
The situation in the Dominican Republic differed from that in Jamaica in that of prime importance at the sites visited was the giant freshwater prawn that is raised in semi-intensive polyculture with common carp. This afforded an opportunity to verify commercial model predictions for carp. Tilapia was of relatively little importance at the fish farms that were visited.
• Urban market demand
As explained, the situation in the Dominican Republic is the same as in Jamaica in that virtually all sites score VS due to high population density among the island states in comparison with continental Latin America. In practice, farmers transported fish from 60 to 200 km to urban markets with the median less than 100 km, often, at first, over poor roads.
• Water temperature and growth
The growth models for carp predict 1.7 to 2.3 crops/y, the maximum number of crops, with a harvest weight of 0.6 kg, for all of the Dominican Republic, except for small areas in the west central and south west.
All of the verification sites were in areas for which the maximum number of crops/y were predicted. In comparison, the verification data show harvest weights ranging from 0.2 to 2.7 kg and numbers of crops/y from 1.7 to 3 (Fig. 18). It has to be kept in mind that polyculture with prawn may condition the weight at which carp are harvested and the number of cycles per year obtained. The limited data suggest that actual results for carp are better than those predicted by the model.
Water temperatures, obtained as ranges of minimums and ranges of maximums at each farm indicate near optimum ranges for growth, except for one farm (Fig. 19).
• Water availability
In the Dominican Republic a large area in the east along the border with Haiti is predicted to be MS or US for water availability. Of the sites visited, all were predicted to be S or VS with regard to water. In fact, water availability was not mentioned as a constraint at any site, in contrast to Jamaica.
The most frequently used source of water was a river or stream with one-half of the ponds gravity fed. The other source was reservoirs via canals.
• Soil and Terrain Suitability
Soil and terrain suitability for ponds are predicted to be from US to MS for a large area running from the NW to the SE of the Dominican Republic. Of the 8 verification sites, 5 were predicted to be MS, 2 S and 1 VS. All but one of the sites was on flat terrain. Soil suitability for ponds was rated good at 6 sites and at 2 sites as fair. These latter two corresponded to sites where soil and terrain suitability were predicted to be only fair.
These results suggest that soil and terrain thresholds may be too stringent as actual conditions were better than predicted.
• Agriculture by-products as inputs
Much of the country is predicted to be MS for the availability of agriculture by-products and there are relatively small areas predicted to be US.
Predictions on the 8 farms were 1 VS, 3 S and 4 MS. In the event, only one farm was using an agriculture by-product, rice bran, as a fertilizer in an area predicted to be MS for this purpose. Two other farms were using mainly manures while the remaining 5 depended mainly on commercially formulated feeds as inputs.
Because 7 of the eight farms were semi-intensive, agriculture by-products would not have been considered as an important source of inputs.
• Farm gate sales
There are relatively small areas of the Dominican Republic that are predicted to be US or MS, mainly in the center, SW and SE.
Of the 8 farms, only 3 depended fully, or almost fully on farm gate sales of carp. Of these three, one was predicted to be VS, one S and the other, MS. Of the 5 farms not depending on farm gate sales, 3 were predicted to be MS for this purpose and other 2 farms, S.
In so far as population density reflects potential for farm gate sales, this criterion appears to be a fair predictor of farm gate sales in the Dominican Republic.
The results of this study indicate a favourable environment for inland fish farming among Caribbean island states in terms of temperature regimes stimulating good growth of fishes and human population densities sufficient to spur urban and local market demands.
The verification studies in Jamaica and the Dominican Republic clearly show that the predictions are indicative of potential for fish farming in ponds in a general way. However, the results are affected by a number of factors including the resolution of the study, and the relevance, limited number and weights applied to the criteria in order to make the models.
Resolution. The resolution of the study, 5 arc minutes, is relatively coarse for the island states. In effect, there are few predictions for the smaller ones because the grid cell size is large in relation to the area of some of the islands.
Relevance of criteria. The predictions have to be interpreted with local conditions in mind. For example, soil and terrain suitability for ponds and farm gate sales appeared to be fairly good predictors of actual conditions, but potential for agriculture by-products has little relevance because most production in Jamaica and the Dominican Republic was at a commercial level. Further, in Jamaica tilapia farming is highly dependent on the availability of piped water intended for irrigated agriculture, on a nearby river, or on ground water. Those able to access the latter two sources generally have done well and the two largest farms have one or the other source. Similarly, in the Dominican Republic a river was the most frequently used source of water.
Weights on criteria. The weights and thresholds placed on criteria for the development of the commercial and small-scale models were conceived with the continental conditions of Latin America in mind. For the Caribbean Island States different weightings and thresholds might be more appropriate. For example, as has been noted, with the population density and travel time thresholds used to establish the urban market demand criterion, virtually all of the Caribbean Island States area rates very suitable. Thresholds more in line with the relatively high population densities and relatively short travel times characteristic of the region could provide better estimates of urban market potential.
Chakalall, B. and P. Noriega-Curtis. 1992. Tilapia farming in Jamaica. In: Goodwin, M.H., S.M. Kau and G.T. Waugh (eds.) Proceedings, Gulf and Caribbean Fisheries Institute, 41: 545–69.
Fishery Information, Data and Statistics Unit. 1998. Aquaculture production statistics 1987– 1996. FAO Fisheries. Circular No. 815, Rev. 10, Rome, FAO 197p.
Jones, P.G. 1997. Rainfall. Machine readable daaset. Centro Internacional de Agricultura Tropical (CIAT). Cali, Colombia
Kapetsky, J.M. and S.S. Nath. 1997. A strategic assessment of the potential for freshwater fish farming in Latin America. COPESCAL Tech. Pap. No. 10. Rome, FAO: 128p.
by
Fabio Grita
FAO GIS Officer
INTRODUCTION
The methodology developed to assess potentials for fish farming in Central and Latin America was extended to the Caribbean area. The analysis was applied to two of the fish species examined for the Central and Latin America (Nile tilapia, and Cyprinius carpio) using the two models (commercial model and small-scale model) developed in the previous study. However this study concentrates on the following simulations:
Crops/year:
| Tilapia | (75% feeding level, 300 g harvest weight) |
| Tilapia | (0.075 kg/m3 CFB (Critical Fish Biomass), 150 g harvest weight) |
| Carp | (75% feeding level, 600 g harvest weight) |
| Carp | (0.075 kg/m3 CFB, 350 g harvest weight) |
GIS procedures which calculate suitability, produce maps and prepare statistics used for the Central and Latin America were modified and applied to the present study.
INPUTS
Simulations: The grids generated from the simulation model were not modified since Caribbean islands were already contained in the original grids of mean monthly temperature used as input data for this model.
Mean monthly rainfall: These grids were used to calculate the water loss from ponds. The Caribbean region was not included in the rainfall grids (at 5' × 5' resolution) that were used for the earlier Latin America study. Therefore, another data set - covering the same area including the Caribbean - provided by Jones (1997) at 10' × 10' resolution grids was used. The difference in resolution causes a decline in the accuracy of the data: comparing areas in South and Central America (adjacent to the Caribbean islands) of the two source grids, a difference between +/- 10 and 50 mm of rain was observed. Although, rigorously, the whole study should have been reduced to the coarser resolution to be consistent with the accuracy of the input data, it was decided to resample the rainfall grids to 5' × 5' cell size. The reason was that it was considered more important to maintain intact the information contained in the other thematic grids (soils, mean monthly temperature, population density, road network, protected areas, water bodies, agricultural potential, city locations and size) and not alter the results of the analysis previously carried out. Therefore, the Caribbean area was extracted, resampled and matched with the previous layers by expanding the cells to exceed the coast line and then “clipping” the grids using the standard template. The result grids were merged with the original 5' × 5' resolution grids. Original grid names were maintained to avoid further modifications of the GIS procedures.
Other data sets: Caribbean islands were already embedded in the other themes used for the suitability assessment. Therefore no changes were made to these grids.
Models: No changes
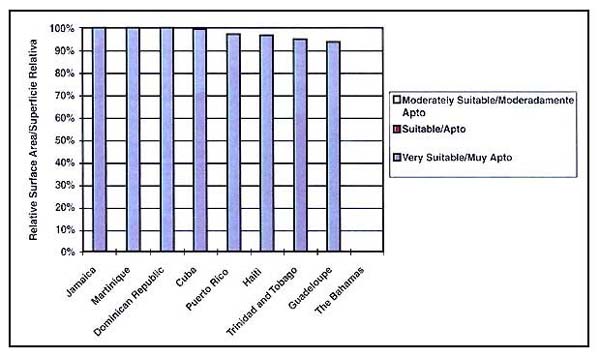
1. Spatial distribution (map) and relative area (histogram) of potential urban markets for commercial fish farming
Distribución espacial (mapa) y superficie relativa (histograma) de la potencialidad de los mercados urbanos para la piscicultura comercial
2. Spatial distribution (map) and relative area (histogram) of net annual water loss from ponds through evaporation and seepage
Distribución espacial (mapa) y superficie relativa (histograma) de la pérdida anual neta de agua de los estanques causada por evaporación y filtración
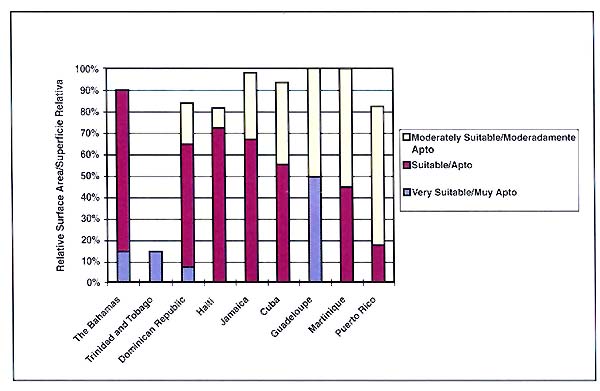
3. Spatial distribution (map) and relative area (histogram) of soil and terrain suitability for ponds
Distribución espacial (mapa) y superficie relativa (histograma) de suelos y terrenos de la aptitud para los estanques
4. Spatial distribution (map) and relative area (histogram) of potential for agricultural by-products as feed and fertilizer inputs
Distribución espacial (mapa) y superficie relativa (histograma) del potencial para disponer de insumos provenientes de subproductos agrícolas, tales como piensos y fertilizantes
5. Spatial distribution (map) and relative area (histogram) of potential for farm gate sales
Distribución espacial (mapa) y superficie relativa (histograma) del potencial para ventas en la granja
6. Spatial distribution (map) and relative area (histogram) of suitability for small-scale fish farming
Distribución espacial (mapa) y superficie relativa (histograma) de la aptitud para la piscicultura de pequeña escala
7. Spatial distribution (map) and relative area (histogram) of suitability for commercial fish farming
Distribución espacial (mapa) y superficie relative (histograma) de la aptitud para la piscicultura comercial
8. Spatial distribution (map) and relative surface area - yield combination in crops/year (histogram) of Nile tilapia with a CFB (critical fishbiomass) of 0,075 kg/m3 and harvested at 150 g
Distribución espacial (mapa) y combinación de superficie relativa con rendimiento (histograma) de la tilapia del Nilo con una BIC (biomasa íctica crítica) de 0,075 kg/m3 y cosechada con 150 g
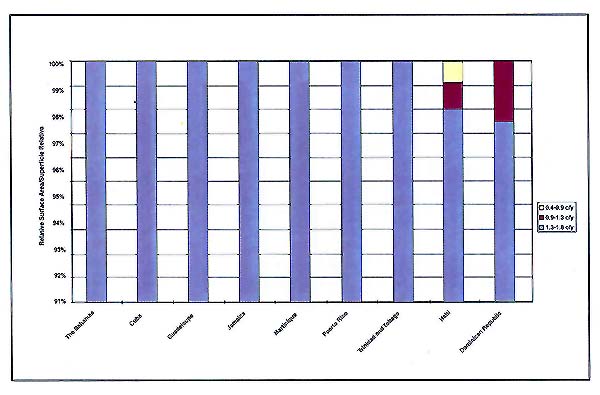
9. Spatial distribution (map) and relative surface area - yield combination in crops/year (histogram) of carp with a CFB of 0,075 kg/m3 and harvested at 350 g
Distribución espacial (mapa) y combinación de superficie relativa con rendimiento en cosechas anuales (histograma) de la carpa con una BIC de 0,075 kg/m3 y cosechada con 350 g
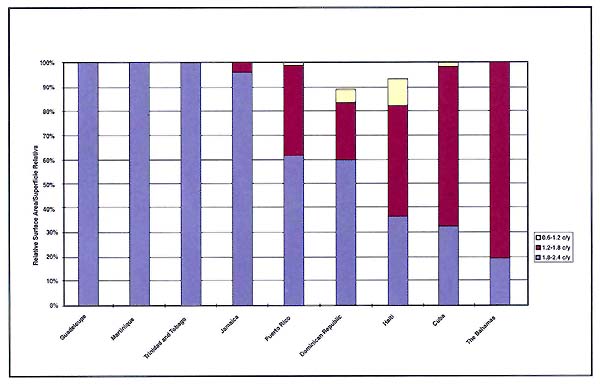
10. Spatial distribution (map) and relative surface area - yield combination in crops/year (histogram) of Nile tilapia fed at 75% satiation and harvested at 300 g
Distribución espacial (mapa) y combinación de superficie relativa - rendimiento en cosechas anuales (histograma) de la tilapia del Nilo alimentada al 75% de saciedad y cosechada con 300 g
11. Spatial distribution (map) and relative surface area - yield combination in crops/year (histogram) of carp fed at 75% satiation and harvested at 600 g
Distribución espacial (mapa) y combinación de superficie relativa - rendimiento en cosechas anuales (histograma) de la carpa alimentada al 75% de saciedad y cosechada con 600 g
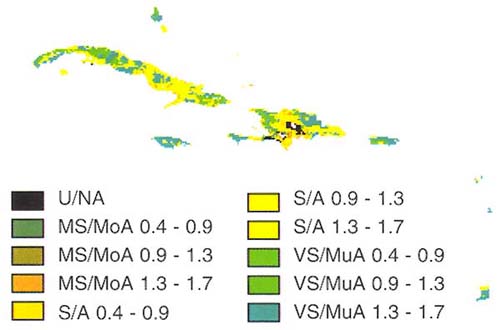
12. Spatial distribution (map) and relative surface area - yield combination in crops/year with suitability for small-scale fish farming (histogram) of Nile tilapia with a CFB of 0,075 kg/m3 and harvested at 150 g
Distribución espacial (mapa) y combinación de superficie relativa - rendimiento en cosechas anuales con aptitud para la piscicultura de pequeña escala (histograma) de la tilapia del Nilo con una BIC de 0,075 kg/m3 y cosechada con 150 g
13. Spatial distribution (map) and relative surface area - yield combination in crops/year with suitability for small-scale fish farming (histogram) of carp with a CFB of 0,075 kg/m3 and harvested at 350 g
Distribución espacial (mapa) y combinación de superficie relativa - rendimiento en cosechas anuales con aptitud para la piscicultura de pequeña escala (histograma) de la carpa con una BIC de 0,075 kg/m3 y cosechada con 350 g
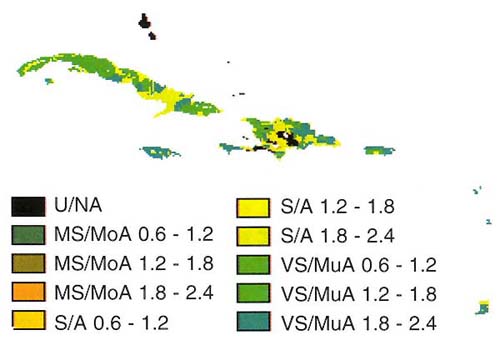
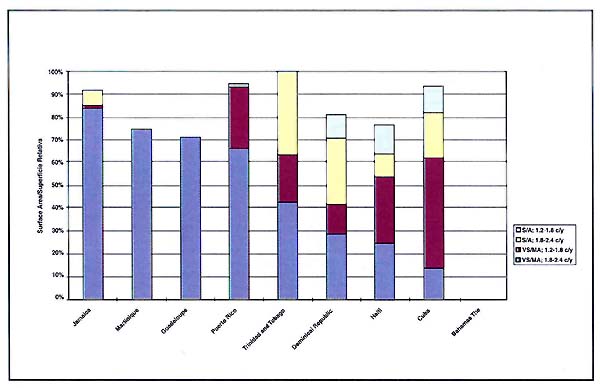
14. Spatial distribution (map) and relative surface area - yield combination in crops/year with suitability for commercial fish farming (histogram) of Nile tilapia fed at 75% satiation and harvested at 300 g
Distribución espacial (mapa) y combinación de superficie relativa - rendimiento en cosechas anuales con aptitud para la piscicultura comercial (histograma) de la tilapia del Nilo alimentada al 75% de saciedad y cosechada con 300 g
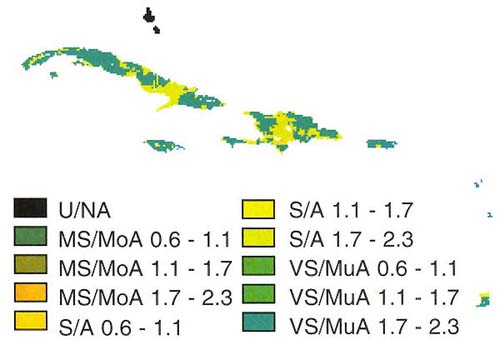
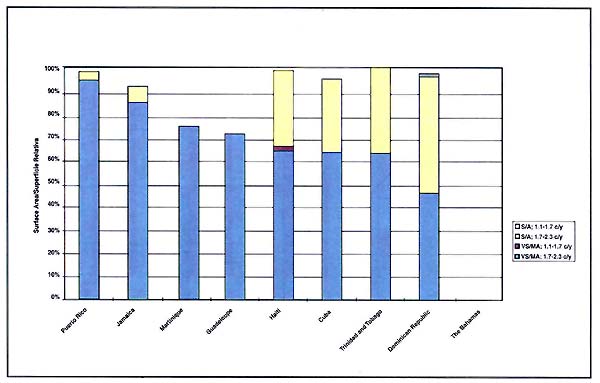
15. Spatial distribution (map) and relative surface area - yield combination in crops/year with suitability for commercial fish farming (histogram) of carp fed at 75% satiation and harvested at 600 g
Distribución espacial (mapa) y combinación superficie relativa - rendimiento en cosechas anuales con aptitud para la piscicultura comercial (histograma) de la carpa alimentada al 75% de saciedad y cosechada con 600 g
 | 16. Numbers of crops per year and weight at harvest of tilapia in Jamaica Número de cosechas anuales y peso de cosecha de la tilapia en Jamaica |
| 17. Early morning water temperature in three ponds in Jamaica Temperatura del agua tomada en las primeras horas de la mañana en tres estanques de Jamaica | 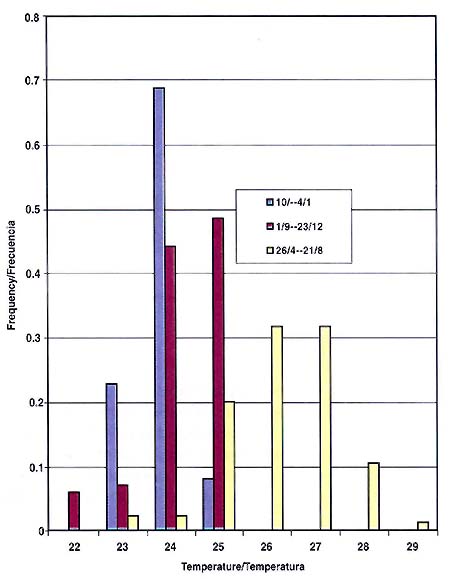 |
 | 18. Numbers of crops per year and weight at harvest of tilapia in the Dominican Republic Número de cosechas anuales y peso de cosecha de la tilapia, en la República Dominicana |
| 19. Minimum and maximum warm season and cool seasons pond temperatures in the Dominican Republic Temperaturas máximas y mínimas en los estanques durante la estación calurosa y la estación fresca en la República Dominicana | 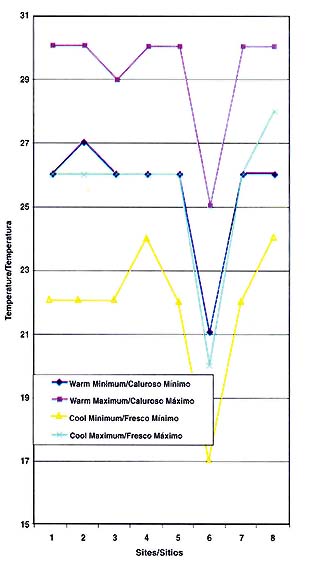 |
![]()
![]()