![]()
![]()
![]()
The productivity of fresh waters depend on various inter-related physicochemical as well as biological factors such as water conductivity, pH values, depth, temperature, wind, primary production levels, species compositions and ecological characteristics. Table 8 presents some important features of the major shared lakes of the region.
Table 8 Characteristics of major shared lakes
| Lake | Altitude (m) | Max. depth (m) | Mean depth (m) | Surface km2 | Productivity (kg/ha/yr) | |||||
|---|---|---|---|---|---|---|---|---|---|---|
| Albert | 618 | 58 | 25 | 5 270 | 47–65 | |||||
| Chilwa | 654 | 5 | 2 | 750 | 77 | |||||
| Chiuta | 620 | 5 | - | 200 | 75 | |||||
| Cohoha | 1 380 | 11 | 5 | 76 | 26–37 (*) | |||||
| Edward | 914 | 117 | 34 | 2 300 | 61–70 | |||||
| Kariba | 485 | 120 | 29 | 5 364 | 30–41 | |||||
| Kivu | 1 463 | 489 | 240 | 2 370 | 27–42 | |||||
| Malawi | 471 | 758 | 426 | 30 800 | 35–45 | |||||
| Mweru | 930 | 37 | 7 | 4 650 | 60 | |||||
| Rweru | 1 350 | 4 | 2 | 100 | - | |||||
| Tanganyika | 773 | 1 435 | 700 | 32 900 | 90 | |||||
| Turkana | 406 | 73 | 30 | 7 570 | 9–16 | |||||
| Victoria | 1 136 | 84 | 40 | 68 000 | 29–59 | |||||
| Source: Vanden Bossche and Bernacsek (1990). | ||||||||||
| (*) including Lake Rweru | ||||||||||
In general, global potential productivities of water bodies are not properly known, and often difficult to scientifically assess. This explains part of the variance in the estimates presented in Table 8. Some of these productivity estimates may therefore be quite inaccurate.
On the basis of available information, the mean annual production potential is estimated to be between 720 000 and 980 000 tonnes for the shared lakes under review. Present annual production levels for those lakes, on the other hand, reached about 876 000 tonnes per year in 1989–91, of which 563 000 tonnes were from Lake Victoria alone (Table 9).
Table 9 Potential and present production levels by lake (tonnes)
| Lake | Country | Potential production | Present production | ||||
|---|---|---|---|---|---|---|---|
| Albert/Mobutu | Zaire | 11 500 | - | 15 500 | 10 000 | [1989] | |
| Uganda | 13 500 | - | 18 500 | 13 900 | [1989] | ||
| Total | 25 000 | - | 34 000 | 23 900 | [1989] | ||
| Chilwa | Malawi | 20 000 | 13 700 | [1989] | |||
| Mozamb. | - | (**) | |||||
| Total | 20 000 | 13 700 | [1989] | ||||
| Chiuta | Malawi | 1 500 (*) | 1 100 | [1989] | |||
| Mozamb. | ? | (**) | |||||
| Total | 1 500 | 1 100 | [1989] | ||||
| Cohoha/Rweru | Burundi | 400 | - | 450 | 228 | [1991] | |
| Rwanda | 150 | - | 200 | 136 | [1991] | ||
| Total | 450 | - | 650 | 354 | [1991] | ||
| Edward | Zaire | 10 000 | - | 11 000 | 10 700 | [1989] | |
| Uganda | 4 000 | - | 5 000 | 3 700 | [1989] | ||
| Total | 14 000 | - | 16 000 | 14 400 | [1989] | ||
| Kariba | Zambia | 8 000 | 9 200 | [1990] | |||
| Zimbabwe | 8 000 | - | 14 000 | 21 500 | [1990] | ||
| Total | 16 000 | - | 22 000 | 30 700 | [1990] | ||
| Kivu | Rwanda | 2 300 | - | 4 000 | 2 900 | [1991] | |
| Zaire | 4 200 | - | 6 000 | 1 700 | [1991] | ||
| Total | 6 500 | - | 10 000 | 4 600 | [1991] | ||
| Malawi/Nyasa | Malawi | 73 200 | - | 97 600 | 37 700 | [1991] | |
| Mozamb. | 19 200 | - | 25 600 | 3 000 | est. | ||
| Tanzania | 15 000 | 28 700 | [1990] | ||||
| Total | 107 400 | - | 138 200 | 69 400 | |||
| Mweru | Zaire | 12 | 000 | 3 000 | [1989] | ||
| Zambia | 16 | 000 | 17 200 | [1990] | |||
| Total | 28 | 000 | 20 200 | ||||
| Tanganyika | Burundi | 21 | 000 | 23 500 | [1991] | ||
| Tanzania | 122 | 000 | 64 900 | [1990] | |||
| Zambia | 19 | 000 | 15 500 | [1990] | |||
| Zaire | 135 | 000 | 30 000 | [1991] | |||
| Total | 297 | 000 | 133 900 | ||||
| Turkana | Kenya | 5 000 | - | 10 000 | 1 100 | [1991] | |
| Ethiopia | 2 000 | (**) | |||||
| Total | 7 000 | - | 12 000 | 1 100 | |||
| Victoria | Kenya | 186 300 | [1991] | ||||
| Tanzania | 231 600 | [1990] | |||||
| Uganda | 145 000 | [1991] | |||||
| Total | 200 000 | - | 400 000 | 562 900 | |||
| TOTAL -without Victoria | 522 850 | - | 579 350 | 313 354 | [1989/91] | ||
| TOTAL -with Victoria | 722 850 | - | 979 350 | 876 254 | [1989/91] | ||
Sources: Potential production: Vanden Bossche and Bernacsek (1990); for Lake Victoria: estimated by the authors based on present species mix; most recent production: Gréboval and Fryd (1993). | |||||||
Table 9 provides a detailed comparison of potentials and actual estimated production levels per lake and country. Globally it may seem that the fisheries resources of these lakes are fully exploited, if not slightly overexploited. But any generalization at this level is misleading. In fact the degree of resource exploitation varies greatly from lake to lake, and according to two main types of fisheries: demersal/inshore and pelagic/offshore (Table 10). Furthermore, the status of the fish stocks of Lake Victoria, by far the most productive lake at present, is quite uncertain.
Table 10 Status of exploitation by lake and type of resources
| Lake | Type of fisheries | Exploitation status |
| Albert | -Demersal/inshore -Pelagic/offshore | -Heavily exploited -Lightly exploited |
| Chilwa/Chiuta | -All combined | -Heavily exploited |
| Cohoha/Rweru | -Demersal/inshore -Haplochrom./offshore | -Overexploited -Not exploited |
| Edward | -Demersal/inshore -Haplochrom./offshore | -Overexploited -Not exploited |
| Kariba | -Demersal/inshore -Pelagic/offshore | -Heavily exploited -Near fully expl.? |
| Kivu | -Demersal/Haplochrom. -Pelagic/offshore | -Moderately expl. -Moderately expl. |
| Malawi/Nyasa | -Demersal/inshore -Pelagic/offshore | -Heavily/overexpl. -Lightly exploited |
| Mweru-Luapula | -Demersal/inshore -Pelagic/offshore | -Heavily/overexpl. -Lightly exploited |
| Tanganyika | -Demersal/inshore -Pelagic/offshore | -Moderately expl. -Lightly exploited |
| Turkana | -All combined | -Underexploited |
| Victoria | -Nile perch -Tilapia -Pelagic/offshore | -Overexploited -Heavily exploited -Lightly exploited? |
Note: Status of exploitation based on the authors' assessment of relevant literature, and therefore quite subjective.
The information contained in Table 10 reflects the generally accepted opinion of scientists on the overall status of exploitation of fisheries resources by lake and type of resources. The only generalization which one may derive from the information contained in Tables 9 and 10 is that the demersal/inshore resources of the lakes are currently heavily or overexploited, while pelagic/offshore resources remain lightly or moderately exploited. This is a rather common characteristic of the historical evolution of fisheries exploitation: an evolution related to the generally higher cost of fishing offshore and to the rather high price differential which exists between demersal species and small pelagics.
This historical evolution is to a certain extent reflected in the evolution of total production from the lakes under review (Table 7; Figure 3). Over a 20 year period (1970–1989), fish production increased from 195 000 tonnes to 307 000 tonnes (excluding Lake Victoria). This constitutes a sizeable increase, but a closer examination of the contribution of the various lakes to such an increase shows that it mostly reflects increased landings from Lake Tanganyika and Lake Kariba, i.e. an increase in the production of small pelagics as these constitute 75 to 85% of total production for these two lakes. Although its contribution to total production remains limited, this also applies to Lake Kivu.
The evolution of fish production from other major lakes is characterized on the other hand by the relative stagnation of total production, with increased landings of small pelagics or haplochromines (low-priced species) compensating for decreased landings of demersals (Lakes Malawi, Mweru and Victoria [until 1980]).
Figure 3 Evolution of fish production by lake (1970–1989)
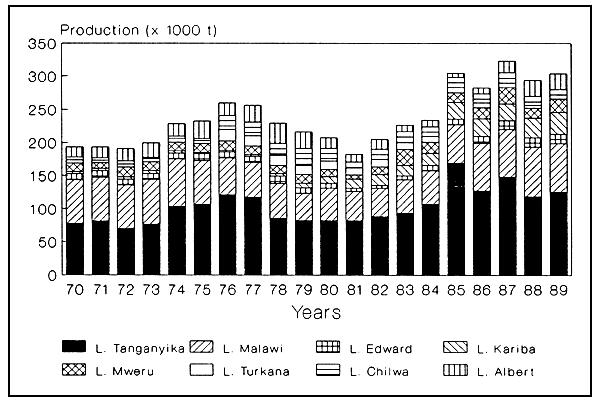
Figure 4 illustrates the evolution of total production from all lakes under review, including Lake Victoria. The phenomenal increase in production from Lake Victoria since 1980 is related to the proliferation of Nile perch in the late 1970s and its subsequent impact on species composition. Essentially composed of haplochromines (a wide range of hard to exploit species of very low commercial value), the fish biomass of Lake Victoria was indeed modified drastically in a few years and is now composed mostly of three species: Nile perch (Lates niloticus), Oreochromis niloticus and the small pelagic Rastrineobola argentea. These being easily exploitable and readily marketable species, fishing activity boomed as a result. Even if one can reasonably express some doubts about the reliability of production statistics, the evolution of fish production from Lake Victoria is very impressive.
Figure 4 Evolution of fish production by lake (1970–1989)
(Total production including Lake Victoria)
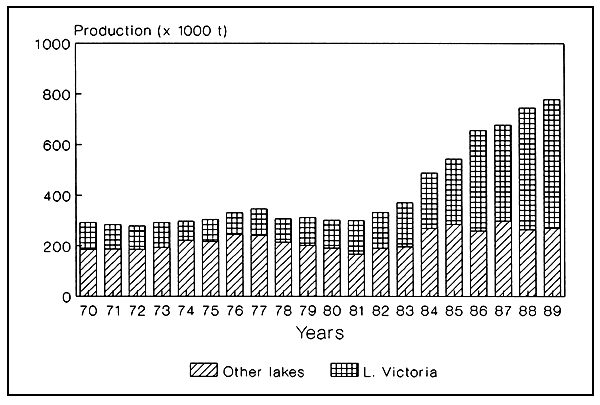
Production actually increased from an average of about 100 000 tonnes in the 1970s to 260 000 tonnes in 1985, and to over 500 000 tonnes since 1989. As such, the production of Lake Victoria constitutes over 60% of total production from the lakes under review. It now represents around 50% of inland production and 40% of total inland and marine production for the region.
Such a drastic increase in landings from Lake Victoria has only been made possible by the very rapid expansion of the market base: extension to the major urban centres in the three countries concerned, development of overseas exports of Nile perch, development of exports to neighbouring countries like Zaire, Rwanda, Burundi, Sudan, Zambia, Mozambique. This expansion has affected significantly previous marketing channels and production from other lakes. For example, part of the Ugandan production from Lakes Albert and Edward/George used to be marketed in Kampala and the southwestern part of the country. Now most of the production which is not directly marketed on nearby markets is exported to Zaire. Similarly, exports of dried Rastrineobola argentea have affected prices of related products from Lakes Kivu and Tanganyika and have replaced these products in parts of the countries concerned.
Major commercial species groups and their present contribution to total catch lake-wide are indicated in Table 11. Two major characteristics are to be noted. First, the importance of a limited number of species or species group in the catch, in spite of the relatively high number of species present in most lakes (e.g. Oreochromis spp., Lates niloticus, Limnothrissa miodon). Secondly, the relative importance of introduced species for some of the lakes concerned: 85% of production for Lake Kivu and Lake Kariba, 80% for Lake Victoria, 60% for Lakes Cohoha/Rweru.
Table 11 Major commercial species groups by lake
| Lake | Species | Contribution to present catches | Origin |
|---|---|---|---|
| Albert/Mobutu | Hydrocynus forskahli | 40% | endogenous |
| Lates niloticus | 20% | endogenous | |
| Oreochromis niloticus | 20% | endogenous | |
| Cohoha/Rweru | Oreochromis niloticus | 70% | exogenous |
| Oreochromis macrochir | endogenous | ||
| Edward | Oreochromis niloticus | 60% | endogenous |
| Kariba | Limnothrissa miodon | 85% | exogenous |
| Kivu | Limnothrissa miodon | 80% | exogenous |
| Malawi/Nyasa | Engraulicypris | 20% | endogenous |
| Cichlids | 40–60% | endogenous | |
| Mweru-Luapula | Oreochromis macrochir | 25% | endogenous |
| Poecillothrissa moeruensis | 50% | endogenous | |
| Tanganyika | Stolothrissa tanganicae | 70–80% | endogenous |
| Limnothrissa miodon | endogenous | ||
| Luciolates stappersii | 5–15% | endogenous | |
| Turkana | Tilapia spp. | 15–20% | endogenous |
| Lates niloticus | 30% | endogenous | |
| Victoria | Lates niloticus | 60% | exogenous |
| Oreochromis niloticus | 15–20% | exogenous | |
| Rastrineobola argentea | 20–25% | endogenous |
The relative importance of major species groups and its evolution between 1970–72 and 1988–90 is given in Table 12 for all lakes under review. It should be noted that the figures given in Table 12 have been calculated from existing data for the years indicated or from percentage figures found in the literature and applied to total production data. These are therefore of a strictly indicative nature. Table 12 shows that three major species groups dominated catches in the late 1960s - early 1970s. These are tilapiines, haplochromines, and small pelagics, each representing about 25% of total production.
Nearly two decades later, the composition of fish production has changed drastically owing in particular to the changes that have occurred for Lake Victoria. As production more than quadrupled, one observes in 1988–90 the predominance of Nile perch and small pelagics, which represent respectively 60% and 20% of total production.
Excluding Lake Victoria, the evolution of species composition essentially reveals the growing importance of small pelagics. Indeed this species group now represents close to half of the total production, up from 30% in 1970–72 (Table 12). This increase coincided with a reduction in landings of both tilapiines and haplochromines, not only in percentage terms but in absolute value as well.
Precise data on fishing effort are seldom available and one can only assess its evolution in general terms with respect to the number of crafts used by fishermen. The evolution of the fishing fleet is given in Table 13, by lake and for both traditional/artisanal crafts and semi-industrial vessels. The traditional/artisanal fleet has increased dramatically from 19 000 to 55 000 crafts over the last two decades. However, the most significant increase took place in the 1970s with fleet size more than doubling during this period. It is to be noted that effort increased quite systematically throughout the region during this decade. In the 1980s the fleet increased at a much lower rate and by only 38%. One further notes that fleet size actually decreased in some cases, e.g. for the Burundian and Tanzanian fisheries of Lake Tanganyika. This reflects a tendency towards capital intensification, which is certainly becoming more and more important as countries develop and as easily accessible resources become heavily or overexploited.
| Lake | 1970–1972 | 1988–1990 | ||||||||||
| S.pel | Lates | Tilap | Haplo | Other | S.pel | Lates | Tilap | Haplo | Other | |||
| Albert | 1.0 | 3.3 | 1.6 | - | 10.6 | 0.8 | 4.8 | 4.8 | - | 13.5 | ||
| Chilwao | - | - | 1.3 | - | 3.9 | - | - | 3.7 | - | 11.1 | ||
| Cohohao | - | - | 0.7 | * | 0.4 | - | - | 0.2 | * | 0.1 | ||
| Edward | - | - | 7.0 | * | 3.1 | - | - | 8.6 | * | 5.8 | ||
| Kariba | - | - | 0.5 | - | 3.0 | 28.7 | - | 0.7 | - | 3.8 | ||
| Kivu | - | - | 0.2 | 0.7 | * | 3.2 | - | 0.4 | 1.0 | * | ||
| Malawi | 3.3 | - | 23.0 | 29.5 | 9.9 | 14.7 | - | 14.7 | 23.6 | 20.7 | ||
| Mweru | * | - | 10.0 | - | 2.7 | 10.0 | - | 5.0 | - | 5.2 | ||
| Tang. | 62.0 | 4.0 | 1.0 | - | 10.5 | 87.5 | 12.5 | 3.0 | - | 22.1 | ||
| Turkana | - | 0.7 | 0.3 | - | 3.3 | - | 1.4 | 0.7 | - | 2.0 | ||
| Vict. | 12.0 | * | 23.0 | 36.3 | 25.0 | 95.9 | 319.6 | 55.5 | 5.3 | 30.6 | ||
| Total | 78.3 | 8.0 | 76.6 | 66.5 | 72.4 | 240.8 | 338.3 | 97.3 | 29.9 | 114.9 | ||
| Tot. % | 25.9 | 2.5 | 25.3 | 21.9 | 23.9 | 29.2 | 41.2 | 11.8 | 3.6 | 13.9 | ||
| Excluding Lake Victoria | ||||||||||||
| Total | 66.3 | 8.0 | 53.6 | 30.2 | 47.4 | 144.9 | 18.7 | 41.8 | 24.6 | 84.3 | ||
| Tot. % | 32.3 | 3.9 | 26.1 | 14.7 | 23.1 | 46.1 | 5.9 | 13.3 | 7.8 | 26.8 | ||
o Lakes Chilwa and Chiuta combined; Lakes Cohoha and Rweru combined
(*) Limited landings
Note: ‘Other’ may include ‘not identified’ landings.
Table 13 Evolution of small-scale and semi-industrial fleet size (1969–1979–1989)
| Lake | Country | Artisanal/Traditional | Semi-industrial | ||||
| 1969 | 1979 | 1989 | 1969 | 1979 | 1989 | ||
| Albert | Uganda | 826 | 1300 | 1349 | - | - | - |
| Zaire | 1800 | 2100 | 2088 | 20 | 8 | 1 | |
| Chilwa | Malawi | 700 | 700 | 2030 | - | - | - |
| Mozamb. | ? | ? | ? | - | - | - | |
| Chiuta | Malawi | 200 | 200 | 350 | - | - | - |
| Mozamb. | ? | ? | ? | - | - | - | |
| Cohoha | Burundi | 65 | 64 | 160 | - | - | - |
| Rwanda | 65 | 82 | 70 | - | - | - | |
| Edward | Uganda | 300 | 400 | 408 | - | - | - |
| Zaire | 100 | 383 | 726 | 5 | 1 | - | |
| Kariba | Zambia | 294 | 549 | 1835 | - | 82 | 199 |
| Zimbabwe | 200 | 200 | 409 | - | 65 | 213 | |
| Kivu | Rwanda | 500 | 500 | 981 | - | - | - |
| Zaire | 1000 | 1000 | 1375 | - | - | 1 | |
| Malawi | Malawi | 4000 | 4800 | 10260 | ? | 17 | 22 |
| Mozamb. | ? | ? | ? | - | - | - | |
| Tanzania | 1898 | 2200 | 2418 | - | - | - | |
| Mweru | Zambia | 4155 | 2600 | 6600 | - | - | - |
| Zaire | 2000 | 3962 | 3377 | ? | 14 | 1 | |
| Rweru | Burundi | 112 | 81 | 80 | - | - | - |
| Rwanda | 130 | 89 | 60 | - | - | - | |
| Tanganyika | Burundi | 1965 | 1148 | 1000 | 11 | 21 | 17 |
| Tanzania | 3712 | 7000 | 3747 | - | 4 | 6 | |
| Zambia | 400 | 479 | 1278 | 3 | 2 | 14 | |
| Zaire | 3500 | 3500 | 4862 | ? | 8 | 15 | |
| Turkana | Ethiopia | ? | ? | ? | - | - | - |
| Kenya | 45 | 195 | 201 | - | - | - | |
| Victoria | Kenya | 4000 | 4900 | 6229 | - | - | - |
| Tanzania | 3000 | 4457 | 7757 | - | 5 | 20 | |
| Uganda | 2643 | 3000 | 8000 | - | - | 2 | |
| TOTAL | 19012 | 39385 | 55778 | 17 | 170 | 483 | |
Note: Data from Gréboval and Fryd (1993), year indicated or closest year. Underlined figures are estimates by the authors.
In terms of readily available information, one can distinguish traditional from artisanal fisheries on the basis of the type of craft used: dugouts and planked canoes respectively. This generally reflects differences in capital intensity for the fishing unit as a whole and a semi-subsistence level of operation for the traditional operators. On this basis, a comparison of available surveys shows a relative or absolute decrease in the number of dugouts used on most lakes. Linked to reduced availability of appropriate tree trunks and the introduction of more efficient fishing techniques, the relative importance of dugout canoes seems to have decreased especially over the last decade.
As a consequence of the above, fishing effort in the traditional/artisanal sector appears to have increased nominally by close to 300% over the last two decades, and by significantly more in real terms. The evolution of the small-scale fleet of Burundi is a characteristic example. The artisanal fleet grew in the 1960s to over 400 catamaran/liftnet units, reaching 600 units in 1980 and 670 in 1990. Meanwhile, the traditional fishery regressed from around 1 500 units in the 1960s to 700 in the 1970s and less than 400 in the 1980s (Bellemans, 1991a). Over the last decade, effective fishing effort from the catamaran units has also increased quite significantly as a result of greater efficiency. The result is an increase of 160% in production over the last 20 years, combined with a 50% reduction in total fleet size. It is interesting to note that the traditional fleet has recently been increasing again, but that it is now fully targeting its effort on specific but limited inshore stocks which are not exploited by other fleets: a sign of definite specialization and of adjustment of the means of production to the resource base. In other words, the Burundian fishery sector is showing signs of maturity.
As regards the semi-industrial fleet, its evolution is also characterized by rapid growth. Fleet size increased from 30 to 60 boats in 1969, to 170 in 1979 and 483 in 1989. The most important fleet is by far that of Lake Kariba with 412 boats (rigs/liftnet units). This is, according to the authors (Horemans and Hoekstra, 1992), the only fleet whose operation is not only financially viable but also fully justified. Indeed, from an economic point of view, semi-industrial exploitation is not as beneficial as artisanal exploitation if one gives due consideration to employment and value added. The development of semi-industrial fisheries may nevertheless be justified if some stocks may not be exploited otherwise (in Lake Kariba, artisanal exploitation has not proven feasible) or if it allows for added marketing possibilities.
The second largest fleet is that of Lake Tanganyika where around 50 purse seiners are now operating. Industrial exploitation of small pelagics on this lake is essentially justified by the added marketing opportunities it may confer. In Burundi and Tanzania, these opportunities are very limited and, given the relative efficiency of artisanal units, semi-industrial units are no longer financially viable and in regression (Horemans, 1992). In Zambia and Zaire the fleets are linked to processing and long distance marketing facilities. The operation of these facilities has nevertheless been constrained by relative isolation and, in the case of Zaire, by a succession of politico-economic crises.
These have also, affected other semi-industrial operations on the Zaire side of Lakes Albert, Edward, and Mweru. These were based essentially on the operation of barges used as mother ships in connection with a fleet of small scale crafts, with shore facilities for processing and marketing. Today, only a few barges are still in operation. Semi-industrial fishing on other lakes is limited, sometimes by regulation as for the Ugandan and Kenyan portion of Lake Victoria, and not very profitable.
Indicators of productivity (production per boat and fisherman) are given in Table 14 for recent years. It shows production by boat ranging from 0.6 to 1.4 t/yr for Lakes Cohoha and Rweru (predominantly traditional-subsistence fisheries); from 3 to 7 t/yr for Lakes Albert, Chilwa Chuita, Malawi, Turkana; and from 11 to 14 t/yr for Lakes Kariba, Tanganyika, and Edward (predominantly pelagic artisanal fisheries).
Table 14 Number of boats/fishermen and productivity by lake
| Lake & year of reference | Country-fleet type | Fish prod. (1 000 t) | Fleet size | Prod./boat/year (t) | No. of fishermen | Prod./fisherman/year (t) |
| Albert | Zaire | 13.9 | 2088 | 6.6 | 8500 | 1.6 |
| [1989] | Uganda | 10.0 | 1349 | 7.4 | 11942 | 0.8 |
| Total | 23.9 | 3437 | 6.9 | 20442 | 1.2 | |
| Chilwa-89 | Malawi | 13.7 | 2030 | 6.7 | 3949 | 3.5 |
| Chuita-89 | Malawi | 1.1 | 350 | 3.1 | 1443 | 0.7 |
| Cohoha-91 | Total | 0.14 | 230 | 0.6 | 280 | 0.5 |
| Edward | Zaire | 10.7 | 726 | 14.7 | 4015 | 2.7 |
| [1989] | Uganda | 3.7 | 408 | 9.1 | 1428 | 2.6 |
| Total | 14.4 | 1134 | 12.7 | 5443 | 2.7 | |
| Kariba | S.scale | 4.0 | 2244 | 1.8 | 5828 | 0.7 |
| [1990] | Indust. | 29.2 | 396 | 73.7 | 1232 | 23.7 |
| Total | 33.2 | 2640 | 12.6 | 7060 | 4.7 | |
| Kivu | Tradit. | 1.4 | 1375 | 1.0 | 3536 | 0.4 |
| [1991] | Trimaran | 3.2 | 329 | 9.7 | 1315 | 2.4 |
| Total | 4.6 | 1704 | 2.7 | 4851 | 0.9 | |
| L.Nalawi- | Malawi | 38.9 | 10022 | 3.9 | 22000 | 1.8 |
| (Nyasa) | Tanzania | 28.7 | 2052 | 14.0 | 6255 | 4.6 |
| [1990] | Total | 67.6 | 12074 | 5.6 | 28255 | 2.4 |
| Nweru-90 | Zambia | 17.5 | 7707 | 2.3 | 18872 | 0.9 |
| Rweru-91 | Total | 0.2 | 140 | 1.4 | 160 | 1.25 |
| Tanganyika | Burundi | 21.5 | 1113 | 19.3 | 4815 | 4.5 |
| [1990] | Tanzania | 64.9 | 4495 | 14.4 | 15797 | 4.1 |
| Zaire | 30.0 | 4862 | 6.2 | 13158 | 2.3 | |
| Zambia | 15.5 | 1292 | 12.0 | 3625 | 4.3 | |
| Total | 131.9 | 11762 | 11.2 | 37395 | 3.5 | |
| Turkana-91 | Kenya | 1.1 | 202 | 5.4 | 1600 | 0.7 |
| Victoria | Kenya | 185.1 | 6225 | 29.7 | 22000 | 8.4 |
| [1990] | Tanzania | 231.6 | 7797 | 29.7 | 29095 | 7.9 |
| Uganda | 145.0 | 8000 | 18.1 | 30240 | 4.8 | |
| Total | 561.7 | 22022 | 25.5 | 81335 | 6.9 |
Note: Underlined figures: survey data on fishermen/owners × 2 (Kariba-Mweru); estimate from fisherman/boat ratio of previous years (Uganda-Edward); survey data/2 to reflect average crew size (Trimaran-Kivu).
The high production/boat achieved in the essentially artisanal fisheries of Lake Victoria is noteworthy: 18 to 29 t/yr. Fishing on both Lake Victoria and Lake Edward is conducted predominantly with gillnets and is rather intensive; it is interesting, therefore, to note that production/boat for Lake Victoria is about twice as high as that of Lake Edward, itself a rather productive lake.
For some of the lakes under review, significant differences exist among riparian countries. Some can be explained by differences in productivity or in effort intensity (e.g. Lake Edward, Lake Tanganyika), but others essentially reflect statistical bias (Lake Malawi/Nyasa, Lake Victoria). In general Tanzanian data appear to be rather high in comparison with data from neighbouring countries, with no significant differences in effort composition and intensity.
In the semi-industrial sector, production per boat varies : 75 t/yr for the Kariba fleet; from 100 (Burundi) to 300 (Zaire-Zambia) t/yr for Lake Tanganyika; around 150 t/yr for the composite fleet of Malawi; and around 200 t/yr for the small trawlers operating on Lake Victoria.
Production/fisherman varies from 0.5 to 1.2 t/yr for Lakes Albert, Chiuta, Cohoha, Kivu, Mweru, Rweru and Turkana, reflecting rather low capital intensity in fishing inputs. For other lakes indicative figures also reflect differences in capital intensity and resource productivity, with production/fisherman ranging from around 2.5 t/yr for Lakes Malawi and Edward, to 3.5 t/yr for Lake Tanganyika, 4.7 t/yr for Lake Kariba and 6.9 t/yr for Lake Victoria.
These data should be interpreted with caution, however, as significant discrepancies exist in the recording of the number of fishermen. For some countries ‘fishermen’ are defined with respect to ownership of boats or gear (Zambia, Zimbabwe), for others, average crew size is considered but, depending on the purpose of data collection, absentee owners or rotating crews are sometimes accounted for. Whenever the information was available, these factors were adjusted in Table 14 to reflect effective average crew size.
Primary employment in the fisheries sector is given in Table 15 for the countries concerned. It refers to employment directly related to harvesting activities and generally excludes occasional and part-time fishermen. Table 15 shows that close to 400 000 people are employed in the inland fisheries sector in the region, with Zaire and Tanzania having the highest number of fishermen. Primary employment in the marine sector is comparatively much lower and concerns only 70 000 people. Because of the lack of systematic census and difficulties associated with definitions, these data should be considered indicative.
Primary employment has also been estimated by the authors for all lakes under consideration. These estimates differ somewhat from the official data as they account for the degree of absentee ownership and crew rotation (albeit quite subjectively). Indeed, the effective management of artisanal units can be considered an actual occupation once the level of investment reaches a certain level (management of staff, inputs and spares, financing, control of landings and sales, etc.). Crew rotation is also quite common for advanced or intensive artisanal fisheries. It is relatively common for the Nile perch fishery of Lake Victoria, the Zairian gillnet fishery of Lake Edward, and for the liftnet fisheries of Lake Tanganyika and Mweru, for example.
Table 15 Primary employment in fisheries by country and lake
| Country | Primary employment Total/Inland | Lake | Crew & employment per boat (1) | Primary employment by lake (2) | ||
| Burundi | 6000 | Albert | 5.9 | 6.0 | 20 622 | |
| Ethiopia | 2850 | 1700 | Chilwa-Chiuta | 2.3 | 2.5 | 5 950 |
| Kenya | 33000 | 27000 | Cohoha-Rweru | 1.2 | 1.2 | 450 |
| Malawi | 21000 | Edward | 4.8 | 6.0 | 6 804 | |
| Mozamb. | 62000 | 2000 | Kariba | 2.7 | 3.0 | 7 920 |
| Rwanda | 2000 | Kivu | 2.8 | 3.6 | 6 134 | |
| Tanzania | 80000 | 65000 | Malawi/Nyasa | 2.3 | 3.5 | 42 259 |
| Uganda | 70000 | Mweru-Luapula | 2.5 | 3.0 | 35 100 | |
| Zaire | 113700 | 113000 | Tanganyika | 3.2 | 4.5 | 52 929 |
| Zambia | 70000 | Turkana | 8.0 | 8.0 | 1 600 | |
| Zimbabwe | 10600 | Victoria | 3.7 | 5.0 | 110 110 | |
| TOTAL | 469150 | 382300 | TOTAL | 289 878 | ||
Source: FAO FIPPDAT (indicative figures, 1990 or most recent).
Accordingly, primary employment in lake fisheries is estimated at about 300 000 people. This excludes a large number of occasional fishermen. On the Zambian side of Lake Mweru, for example, a recent census recorded over 10 000 traps and over 5 000 women fishing with baskets on a part-time basis (Aarnink et al., 1992). Figures on secondary employment in processing, marketing and services are generally not available. Secondary to primary employment ratios are usually used instead. These range from two to four for most fisheries according to capital intensity and productivity. Assuming a ratio of three, total employment in the lake fisheries would be around 1.2 million.
If one further assumes that each person employed supports four dependants on average, there are about 6 million people whose livelihood depends to a large extent on the fisheries of the shared lakes under review, i.e. around 3% of the total population of the region.
![]()
![]()
![]()