This second chapter presents a lake-wide analysis of available statistical information. Emphasis is given to a graphic presentation of catch and effort data compiled by Gréboval and Fryd (1993). The lakes concerned are the shared lakes of the region under consideration as stipulated earlier.
It should be noted that lake-wide data can only be compiled systematically for a limited number of shared lakes; statistical coverage in some countries is largely deficient. This is the case for Zaire, Ethiopia and Mozambique in particular. Furthermore, and especially for those countries, Gréboval and Fryd (1993) had to rely on data and estimates from a variety of sources.
There is no doubt that the reliability of some elements of the data base used for this analysis could be questioned. In the absence of official data, however, the approach of the authors has been to use available estimates to provide an overview of the situation.
Further and sustained efforts are much required to update time series and to assess some of the available historical information (official statistical data as well as informal estimates). In this regard, there is an obvious need to pursue this first attempt towards the establishment of a permanent, functional and more accurate regional data base on the inland fisheries of the region.
The graphic presentation in this chapter emphasizes the evolution of fish production by lake and riparian country. When sufficient historical information was available on a country basis and/or on a species basis, it has been compiled as well. Recent information on fishing effort is also provided for most of the lakes under review.
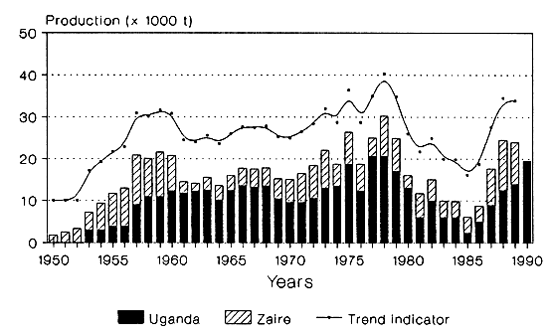
In order to draw global trends on lake-wide production figures, and in the absence of any other information, the authors have had to use their own estimates in a few cases. Trend indicators given in the graphics simply reflect the evolution of total production as estimated, although a fixed amount has been added to dissociate this curve from the histograms (see Figure 5, for example). This was done strictly for illustrative purposes and does not reflect any quantitative adjustment.
Lake Albert (Mobutu) is located at an altitude of 618 m. Its total surface area is 5 270 km2, of which 2 850 km2 (54%) lie in Uganda and 2 420 km2 (46%) in Zaire (Vanden Bossche and Bernacsek, 1990). The fish fauna is composed of some 46 species, but 75–85% of the reported catches consist of Characidae (Alestes bamerose), Hydrocynus forskahli, and Centropomidae (Lates niloticus).
Total annual potential yield of Lake Albert has been estimated to vary between 25 000 and 34 000 t. The potential of the Zairian part could vary between 11 500 (Proude, 1984) and 15 640 t/yr (Vanden Bossche and Bernacsek, 1990).
Annual production figures for both Zaire and Uganda have been available since the early 1950s. Landings increased during the 1950s from 7 000 to 21 000 t. During the 1960s, annual global production figures were down to 15 000 t, and increased again during the 1970s to reach their former level.
The drastic downward trends observed in the early 1980s in both countries are very badly documented. In Zaire, the decline in catch observed since the late 1970s may be attributed to the progressive decline of the industrial fisheries, itself a result of the nationalization (Zairianization) of the companies in the mid 1970s. In Uganda, this trend is probably the result of the civil war which affected particularly this area between the end of Idi Amin's rule in 1979 and Obote's rule in 1985. Since 1987, and under massive equipment imports financed under external assistance, production levels rose again in Uganda and in Zaire. It is to be noted that at this time a significant proportion of fishing inputs imported by Uganda found its way to Zaire. Statistical information for the late 1980s seem thus to indicate that former catch levels of 20–22 000 tonnes for the lake had been reinstated.
On the contrary, information on fleet characteristics and on the number of fishermen have been very sparse (Gréboval and Fryd, 1993). It is estimated that a fleet of 5 690 canoes is presently operating on the lake, 3 200 in Zaire. Of the several semi-industrial units which were operating on the Zaire side in the early 1970s, only one remains active. Employment in the primary sector is estimated at about 20 000 (Gréboval and Maes, 1991).
Figure 5 depicts the historical evolution of Ugandan and Zairian catches for Lake Albert (Mobutu) from 1953 to 1989. In general, the fishery seems to have fluctuated over the years around an average annual production of some 16–18 000 tonnes. Observed cyclic fluctuations are believed to reflect socioeconomic changes more than natural phenomena. Overall the fisheries resources of Lake Albert (Mobutu) are presently underexploited, with offshore stocks remaining largely unfished.
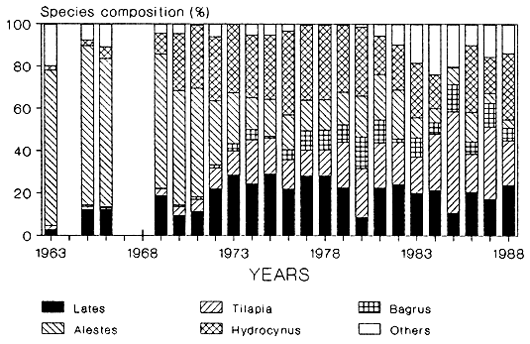
Figure 6 gives an indication of the evolution of species composition in Uganda. Landings of Alestes are seen to have decreased significantly since the early 1970s as less and less effort is applied offshore. Catches are rather multi-specific but Hydrocynus, Lates, and Tilapia represent close to 80% of landings. It is to be noted that in percentage terms catches of Tilapia are significantly higher in Zaire, and inversely for Hydrocynus.
Given the relative isolation of fishing sites, a large proportion of the catch is processed into dry-salted products (80% of the production in Zaire, 60–70% in Uganda). A significant proportion of Ugandan landings is exported to Zaire, perhaps more than 80% according to Corsi (1990).
Figure 5 Production levels for Lake Albert/Mobutu from 1953 to 1989
| Lake Albert/Mobutu Uganda - Zaire |
 |
| Trend indicator = catch + 10000 t |
Figure 6 Lake Albert (Uganda): Composition of catch by species (%)
| Lake Albert (Uganda) |
 |
| Source: Orach-Meza et al. (1990) |
Located at an altitude of 654 m, the total surface area of Lake Chilwa varies between 257 and 2 590 km2, with a mean of 750 km2 and a surrounding swampy area of about 1 000 km2. Only a minute portion of the lake (29 km2 max.) is situated in Mozambique (Vanden Bossche and Bernacsek, 1990). The lake has a mean depth of 2 m, with annual fluctuation of 1.3 m, drying up on occasion (this last occurred in 1968).
Annual production has been fluctuating with water level and area covered. The annual potential yield, for a maximum water area, in Malawi has been estimated at 20 000 t (Chaika, 1982).
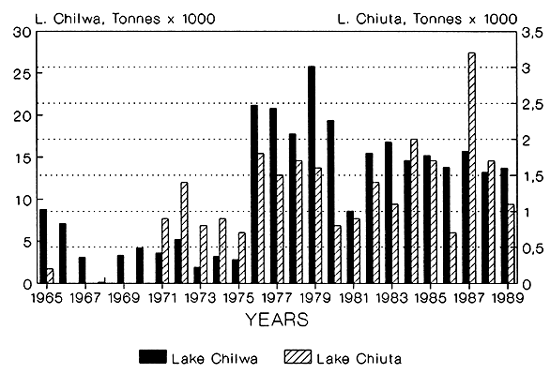
Historical production data are given in Figure 7. Since the introduction of a new statistical system in 1976, annual landings have fluctuated between 8 600 and 25 800 tonnes. Figure 7 shows the impact of the drying up of the lake in 1968. Data prior to 1976 are believed to be somewhat underestimated. Landings from Lake Chilwa have, since 1976, represented 20–30% of the total production of Malawi (GOPA, 1987).
Main catches are composed of Oreochromis shiranus, Barbus paludinosus, Clarias gariepinus and Tilapia rendalli.
In 1982, some 700 fishermen were reported to be fishing on the lake (Chaika, 1982). Available data for 1986 refer to both Lake Chilwa and Lake Chiuta: 2 125 fishing craft were reported, of which 1 992 dugouts and 133 plank boats (15 motorized) (GOPA, 1987). Available data for 1990, pertaining to Lake Chilwa only, provide the following estimates: 3 949 fishermen and assistants, using 1 801 dugouts and 233 plank boats (4 motorized) (Magasa, 1992). In terms of gear, fishermen use mostly traps and gillnets, as well as some seines and longlines.
Located at an altitude of 620 m, the total surface of Lake Chiuta is about 200 km2, of which 40 km2 lie in Mozambique. It has a mean depth of 5 m (Vanden Bossche and Bernacsek, 1990).
Available production data are given in Figure 7. Annual production is shown to have fluctuated between 700 and 3 200 tonnes since 1970, with an average production of about 1 400 tonnes. Figure 7 shows some periodicity in the fluctuation of production.
In 1972, some 200 fishermen were reported to be active on the lake (Chaika, 1982). A frame survey conducted in 1990 showed 1 443 fishermen operating on this lake (343 full time, 125 part time, and 975 assistants), using 282 dugouts and 68 plank boats (Magasa, 1992).
Gear use and species composition are similar to those of Lake Chilwa.
Figure 7 Landings from Lakes Chilwa and Chiuta (Malawi)
| Lake Chilwa & Lake Chiuta |
 |
| Source: GOPA (1987), Mepham (1987) |
Lake Chilwa and Lake Chiuta, Malawi Fish production (tonnes × 1 000)
| Year | 1962 | 1963 | 1964 | 1965 | 1966 | 1967 | 1968 | 1969 |
| L. Chilwa | 3.5 | 3.3 | 5.3 | 8.8 | 7.1 | 3.1 | 0.1 | 3.3 |
| L. Chiuta | -- | -- | -- | 1.8 | -- | -- | -- | -- |
| Year | 1970 | 1971 | 1972 | 1973 | 1974 | 1975 | 1976 | 1977 |
| L. Chilwa | 4.2 | 3.6 | 5.2 | 1.9 | 3.2 | 2.8 | 21.2 | 20.8 |
| L. Chiuta | -- | 0.9 | 1.4 | 0.8 | 0.9 | 0.7 | 1.8 | 1.5 |
| Year | 1978 | 1979 | 1980 | 1981 | 1982 | 1983 | 1984 | 1985 |
| L. Chilwa | 17.8 | 25.8 | 19.4 | 8.6 | 15.5 | 16.8 | 14.6 | 15.2 |
| L. Chiuta | 1.7 | 1.6 | 0.8 | 0.9 | 1.4 | 1.1 | 2.0 | 1.7 |
| Year | 1986 | 1987 | 1988 | 1989 | ||||
| L. Chilwa | 13.8 | 15.7 | 13.2 | 13.7 | ||||
| L. Chiuta | 0.7 | 3.2 | 1.7 | 1.1 |
Situated at an altitude of 1 380 m, Lake Cohoha (Cyohoha in Rwanda) has a total surface area of 76 km2 of which 58 km2 lie in Burundi and 18 km2 in Rwanda. This shallow lake is part of the Upper Akagera Lakes Complex and has a shoreline of some 227 km (167 km in Burundi and 60 km in Rwanda). The mean depth is around 5.2 m with a maximum of 11 m. The potential annual yield has been estimated to be around 200 t due to rather poor phyto- and zoo-plankton production (Vanden Bossche and Bernacsek, 1990).
Total annual production of the Burundian part has been estimated as not exceeding 50 t during the mid 1980s (Corsi et al., 1986) while the Rwandan part produced some 40 t/year. Present exploitation levels represent only about 1/3 of the annual potential of the lake. The partly subsistence and partly commercial fishery on this lake is based on coastal species with Tilapia representing 70–75% of the landings. Catfishes (Synodontis) are also important in the landings, with the recently introduced Clarias gariepinus becoming more common.
The number of fishermen has been estimated as only 50 in Burundi, most of them being also part-time farmers (Corsi et al., 1986).
Major fishing techniques and methods used on this lake are beach seines and gillnets with some hook and lines and a few traps. Recently some attempts have been made by the respective governments to replace the beach seines by the more selective and less destructive gillnets. This was rendered necessary because of continuously declining catches due to the rather poor exploitation of the lake: beach seines, destruction of spawning areas, non-exploitation of the Haplochromis stocks.
In general, it can be stated that the information level concerning the lake fishery is rather poor and very sporadic. Also, many fishery characteristics have been hastily quantified in the past. Further efforts are to be made, both in Burundi and Rwanda, to improve the level of fishery knowledge for this lake.
On the Rwandan side of the lake, the number of fishermen has varied between 60 and 110 since 1982, most of them being part-time farmers who increase their revenues by subsistence fishing. Most recent estimates on the number of fishermen operating on the lake have been put at 280 (80 in Rwanda and 200 in Burundi) for a total of some 230 canoes (160 in Burundi and 70 in Rwanda) (Maes et al., 1991b).
The fishery on Lake Cohoha started in the 1950s, after the introduction of Oreochromis niloticus. Experimental fishing conducted in 1991 with setnetbatteries have shown that the endemic flock of Haplochromis represents around 74% of the catch followed by Synodontis ruandae (16%) and Clarias liocephalus (Maes et al., 1991b). Compared with a similar survey undertaken in 1981, recent survey results show a slight increase in biomass, with a rising proportion of Haplochromis (from 56% to 74%) and a lesser abundance of O. niloticus.
Gréboval and Fryd (1993) provide complementary information available on the production, fleet characteristics and number of fishermen on this lake, from 1970 to 1991.
Lake Edward is located at an altitude of 914 m. It has a total surface area of 2 300 km2 (670 km2 (29%) in Uganda and 1 630 km2 (71%) in Zaire) (Vanden Bossche and Bernacsek, 1990). The maximum depth of Lake Edward is 117 m with an average depth of about 34 m.
Catches are mostly composed of Oreochromis, Bagrus, Barbus, Protopterus and Clarias, while annual potential yield has been put at between 15 000 and 20 000 t for the Zairian part and at 13 000 to 16 000 t for the Ugandan part. The stock of Oreochromis niloticus, estimated to contribute some 70% of the total landings, is presently being overexploited. Tilapia zillii and O. leucostictus, previously lightly exploited, are now appearing in landings on the Zaire side (Mughanda, 1992). On the Uganda side Oreochromis spp. represented only 43% of the catch in 1989, compared to 78% in the early 1970s. Meanwhile Bagrus docmac has increased from 15% to 46% over the same period (Kamanyi and Mwene-Beyanga, 1991).
Historical time series have been rather complete but, due to the variety of sources and methods used in compiling the statistical information, the estimates do not necessarily reflect actual catches and fleet characteristics. Data on the active number of fishing units and number of fishermen have often been limited to duly licensed units/fishermen and one may question how global production figures could then be estimated. Indeed, the lake is surrounded on both sides by national parks where fishing operations are in principle duly regulated. However, illegal fishing has been important at times in both countries. It is known to be very important currently on the Zaire side (Vakily, 1989; Mughanda, 1992).
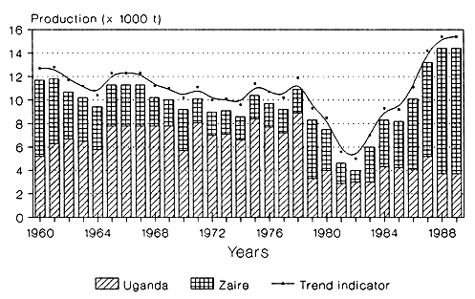
Gréboval and Fryd (1993) have compiled the information available on the production, fleet characteristics and number of fishermen on Lake Edward, from 1960 to 1989. Figure 8 depicts the evolution of landings over time, both in Uganda and in Zaire.
On the Ugandan side, one observes until the late 1960s an increase in production resulting from the development and management efforts made by the fishery administration, which was during those years and still, to a certain extent, is one of the best organized in East Africa (Gréboval and Maes, 1991). Drastic downward trends observed in the 1970s and mid 1980s are mainly the result of the civil war which affected the country between the end of Idi Amin's rule in 1979 and Obote's rule in 1985. Since 1986, thanks to massive equipment imports financed under external assistance, production levels rose slightly.
On the Zairian side, some deficiencies of the statistical system are presumably at the origin of the observed fluctuations, although production figures are somewhat reliable as fishing activities on the lake are administered by a cooperative organism (COPEVI - Vitshumbi Fishermen's Cooperative) and controlled by the administration of the Virunga National Park. Indeed, since the setting up of the National Park in the 1940s, the displaced villagers were given exclusive fishing rights for the exploitation of the fishery within a cooperative framework (COPILE initially).
The evolution of the catches in Zaire reflects the systematic downward trend of the catching capacity of the COPEVI from 1960 to 1974. Initially equipped with modern production (seiners) and processing facilities (salting, drying), the cooperative could neither administer nor renew its equipment. From 1974 onwards, COPEVI decided to liberalize the activity by extending fishing licences to private fishermen. Since that period, the fishery is in full expansion and could have reached its MSY (maximum sustainable yield) level in 1988–89 (Vakily, 1989). Since 1990, fishing activities have been affected by the politico-economic crisis which has led to reduced imports of fishing gear, lower purchasing power, and the proliferation of illegal fishing practices (Gréboval and Maes, 1991).
Most recent information on the fishing fleet of Lake Edward indicates that some 1 041 canoes are operating on the Zaire side of the lake, of which 288 are fishing illegally on the western side, within spawning areas. Annual production estimates indicate that a level of 11 400 tonnes was reached in 1991, of which nearly 50% was caught in illegal areas and with destructive fishing gear (Mughanda, 1992). On the Ugandan side, fishing is taking place within the Queen Elisabeth National Park and is therefore controlled. For Lake Edward (including the Kazinga Channel), the number of canoes is limited to 263, with a maximum of 10 gillnets each, and minimum mesh size of 5 inches. In practice, however, the number of active canoes is much higher and an aerial count in 1989 revealed over 400 canoes (Dunn, 1989). In early 1991, more than 400 illegal canoes were destroyed in an attempt to control fishing effort on both Lakes Edward and George.
Figure 8 Production levels for Lake Edward from 1960 to 1989
| Lake Edward Uganda - Zaire |
 |
| Trend indicator = catch + 1000 t |
Figure 8 depicts production levels on the Ugandan and Zairian sides of the lake from 1960 to 1989. A general trend indicator of this evolution is also presented. It reflects some corrective estimates for the Zairian landings since 1982 (Msakirwa, 1982; Vakily, 1989) and clearly denotes the discrepancy which exists between official data and the corrective estimates.
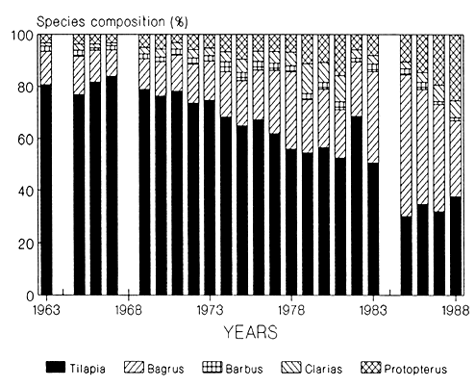
The evolution of species composition in Uganda is given in Figure 9. It shows the declining importance of Oreochromis/Tilapia and the growing percentage contribution of Bagrus and Protopterus. Deeper waters {over 30 m} represent around 70% of the lake and remain largely unexploited. Important stocks of Haplochromis are present in these waters (Vakily, 1989).
Figure 9 Lakes George/Eward (Uganda): Composition of catch by species (%)
| Lake George/Edward, Uganda |
 |
| Source: Orach-Meza et al. (1990) |
Located at an altitude of 485 m, this man-made lake was closed in 1958. The total surface area of the reservoir is 5 364 km2 of which 55% lies in Zimbabwe (2 952 km2) and some 45% in Zambia (2 412 km2). The maximum depth is 120 m with an average depth of 29 m (Vanden Bossche and Bernacsek, 1990).
Main catches are composed of the pelagic Limnothrissa miodon, introduced into the reservoir from Lake Tanganyika in 1967–68. Further substantial landings are reported for tigerfish (Hydrocynus vittatus), mormyrids, and tilapias. The artisanal fishery is traditional and unmechanized and is based on gillnetting in the inshore areas, while the commercial fishery mainly exploits the open-water pelagic resource (Machena and Kanondo, 1991). The majority of the fish species in Lake Kariba are benthic and predatory which is consistent with their riverine origin, before the formation of the lake.
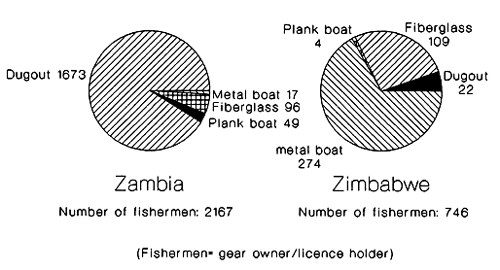
Historical data on the number of fishermen in Zimbabwe are incomplete, often not accounting for ‘industrial’ fishermen (Gréboval and Fryd, 1993). During the 1980s, the number of artisanal fishermen increased significantly and the result of a 1990 survey indicates the existence of some 746 fishermen in Zimbabwe. On the Zambian side, during the 1980s, some 1 900 artisanal fishermen were reported to be active on the reservoir. There were 2 167 in 1990. Movements of traditional fishermen in Zimbabwe are restricted to some 39 fishing camps, while in Zambia they are at liberty to fish where they like and therefore have a much more dispersed distribution over some 256 fishing sites (Thorsteinsson et al., 1991).
Historical information on artisanal fishing crafts is rather poor for Zimbabwe, where 409 active crafts were reported to be operating in 1990. On the Zambian side, on the other hand, information has been more complete since 1980 (Murphree et al., 1989); 1 835 boats were operating in Zambia in 1990, 90% of which were dugouts. The rate of motorization is negligible. Fishermen on both sides use gillnets essentially (3–6 inches) but, because of regulations, the number of nets used by fishermen is reported to be much lower in Zimbabwe (Thorsteinsson et al., 1991).
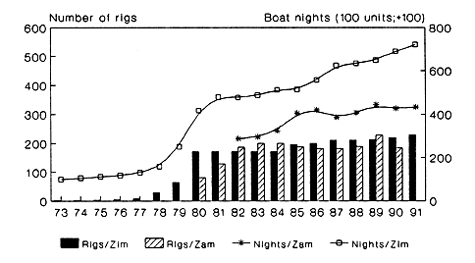
After the successful introduction of Limnothrissa miodon into the reservoir in 1967–68, a pelagic semi-industrial fishery was developed in the early 1970s in Zimbabwe, and in the early 1980s in Zambia. Fishing is based on light attraction and liftnets operated from locally built steel rigs. Present fleet sizes are 230 rigs in Zimbabwe and 185 in Zambia. Data in Zambia do refer to the number of licences issued and may somewhat overestimate actual effort.
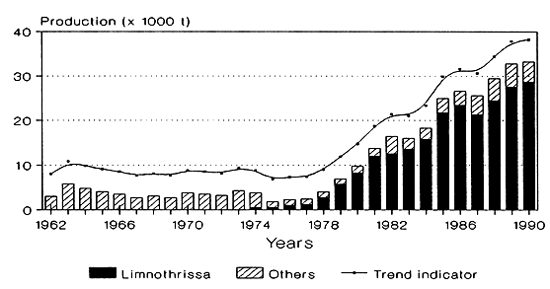
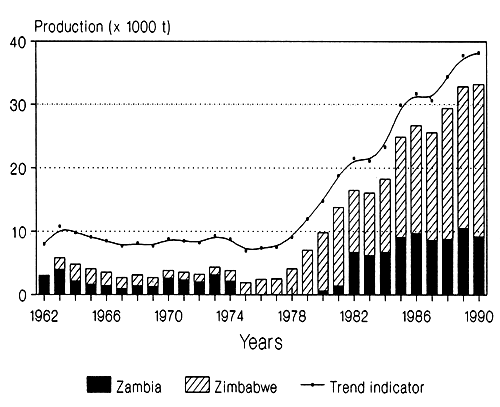
Figure 10 shows the historical evolution of landings for Limnothrissa miodon as compared to the other species, while Figure 11 presents the historical evolution of landings by country. These figures depict a smooth growing trend in the evolution of landings from Lake Kariba. Limnothrissa miodon represents about 50% of the present catch level, a proportion that has been increasing slightly since the late 1970s.
Contribution per country to total production of the lake shows that Zimbabwe has always accounted for around 75–80% of the entire production of the reservoir (Figure 11). This figure also shows the impact of the Zimbabwean war of independence on fishing activities in the late 1970s. It mostly affected small-scale fishing on both sides of the lake, but especially in Zambia.
Figure 10 Production levels for Lake Kariba from 1960 to 1990 (by species)
| Lake Kariba Zambia - Zimbabwe |
 |
| Trend indicator = catch + 5000 t |
The evolution of industrial fleets of both countries is given in Figure 12, showing rapid development in Zimbabwe, and then in Zambia after the successful transfer of this rig-based technology. It should be noted that strict licensing is applied by both countries and that effort expansion is now restricted in Zimbabwe and in Zambia. Rig owners generally process and often retail the production themselves in Zimbabwe, but not in Zambia where most of the production is sun dried by small-scale processors (Horemans and Hoekstra, 1992).
Fishing efficiency appears to be much lower in Zambia, due to weaker company management and to problems in the maintenance/depreciation of equipment. This is reflected in the difference in fishing power (Figure 12), and in CPUE (Catch per Unit of Effort) data which are generally 50% lower in Zambia. (Horemans and Hoekstra, 1992). According to Lupikisha (1992), Zambian catches may be underestimated by as much as 50% because of under reporting. In terms of crew, a significant difference also exists between the two countries, with crew size of two and four to five in Zimbabwe and Zambia respectively. The number of fishermen employed in the pelagic fishery may therefore be estimated at 1 200 to 1 400.
Finally, it is to be noted that Limnothrissa miodon, after its introduction in Lake Kariba, has successfully colonized Lake Cahora Bassa through the Zambezi River.
Figure 11 Production levels for Lake Kariba from 1962 to 1990 (by country)
| Lake Kariba Zambia - Zimbabwe |
 |
| Trend indicator = catch + 5000 t |
Figure 12 Lake Kariba: Evolution of industrial fishing effort and results of recent frame survey
| Evolution of Fishing Effort Pelagic (Kapenta) Fishery: 1973–1991 |
 |
| Source: LKFRI, (1991) Note: Zambian data for number of rigs correspond to licences issued |
| Fleet Composition |
 |
| Source: Thorsteinsson et al. (1991) |
Situated at an altitude of 1 463 m, Lake Kivu has a total surface area of some 2 370 km2 of which 1 370 km2 (58%) lie in Zaire and some 1 000 km2 (42%) in Rwanda. The maximum depth is 489 m with a mean of 240 m (Vanden Bossche and Bernacsek, 1990).
Species which have been introduced into Lake Kivu are: Tilapia rendalli and Oreochromis macrochir (in 1950), O. niloticus, and Limnothrissa miodon (introduced from lake Tanganyika in 1959). Main landings around Lake Kivu are composed of the pelagic Limnothrissa miodon, since the successful development of a catamaran light fishery during the early 1980s (Hanek et al., 1988). Subsistence fishermen also land significant amounts of haplochromines and tilapiines.
The annual potential yield for the lake has been put at about 13 000 tonnes based on the Morpho-Edaphic Index and on zooplankton biomass measurements, while estimates based on acoustic stock assessment studies propose a potential of 2 250 t (Vanden Bossche and Bernacsek, 1990).
The liftnet fishery evolved first in Zaire and later in Rwanda. Catamaran were first used, but these have been progressively converted into more efficient trimaran units since the mid 1980s. At present it is estimated that some 239 units are actively engaged in liftnet fishing, 170 in Rwanda. As far as the traditional canoes are concerned, very limited quantified and reliable information has been available over the years and this fishery has always been underestimated. In 1991, 2 117 traditional canoes were recorded, 811 in Rwanda (Hanek et al., 1991).
Historical time series, as shown by Gréboval and Fryd (1993), have been rather incomplete and, due to the variety of sources and methods used in compiling statistical information, the estimates do not necessarily reflect actual catches and fleet characteristics. Data on the active number of traditional fishing canoes, fishing gear and number of fishermen have been scarce over the years as no statistical data collection system covering the entire fishery sector was in operation around the whole lake until 1990–91 (Lamboeuf, 1990).
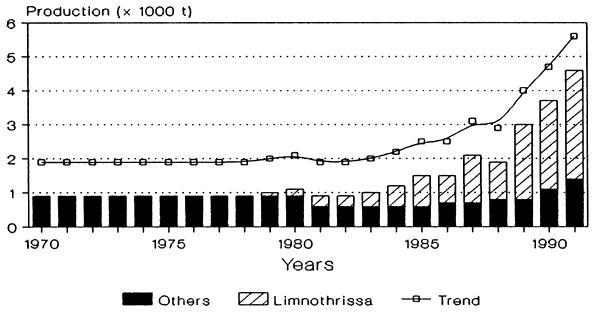
The evolution of landings for Lake Kivu is characterized (Figure 13) by the development in 1979 of a new pelagic fishery based on the exploitation of Limnothrissa miodon which stock had gradually developed and increased in size. In full expansion since 1983–85, this fishery since the end of 1990 has felt the effects of the politico-economical crises affecting both riparian states (Gréboval and Maes, 1991). There are indications that the number of fishing units operating in the pelagic fishery decreased in 1992, for the first time since 1979 (Mughanda and Mutamba, 1992).
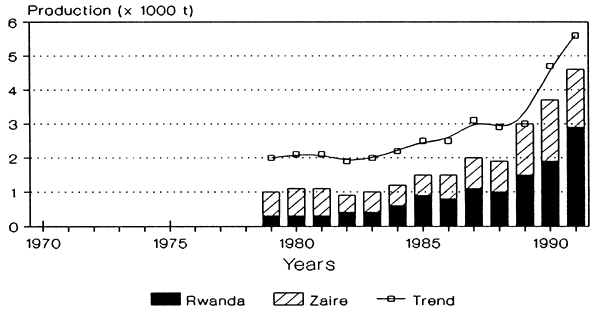
In 1990, total landings of L. miodon were estimated to be around 2 600 tonnes, and those of Haplochromis and other species to total 1 133 tonnes (Lamboeuf, 1991). According to Hanek et al. (1991), the catch of the traditional fishery may be grossly underestimated. These authors estimated the 1990/1991 catch of traditional fishermen at 4 340 t. In 1991 landings of L. miodon increased to 3 195 t (Lamboeuf et al., 1992). Recent catch estimates (Figure 13) have been apportioned by country based on respective fleet size, rather than respective surface area as in Lamboeuf (1991) and Lamboeuf et al. (1992).
Figure 13 Lake Kivu: Landings by species and country (1970–1991)
| Lake Kivu Production by species |
 |
| Trend indicator = catch + 1000 t |
| Lake Kivu Production by countries |
 |
| Trend indicator = catch + 1000 t |
On the Rwandan side of the lake, the liftnet fishery has evolved rapidly under a UNDP/FAO fisheries development project which started in 1979. For the lake as a whole, the number of units increased from only nine in 1973 (all in Zaire), to 54 in 1985 (almost equally divided between the two countries). The fleet later increased rapidly to 103 units in 1986, 164 in 1987, and to 239 in 1991 (Hanek et al., 1991). Since 1983, catamaran fishing units have been progressively replaced by the larger trimarans on the Rwandan side, an evolution which rapidly spread to the whole lake. In 1988, nearly all units had been converted to trimarans.
The number of fishermen operating on Lake Kivu was estimated in 1991 at 6 563, of which 3 027 were employed in the pelagic fishery and 3 536 in the traditional fishery (Hanek et al., 1991). Detailed distribution of effort by fishing gear in 1990 is given in Figure 14 for both Zaire and Rwanda.
Figure 14 Lake Kivu: Distribution of effort by fishing gear (1990)
| Rwanda | Zaire |
 | |
| Source: Hanek et al. (1991) | |
Located at an altitude of 471 m, Lake Malawi/Nyasa has a total surface area of 30 800 km2, of which 24 400 km2 lie in Malawi and 6 400 km2 in Mozambique. Tanzania claims 5 569 km2 of Malawian waters. The total shoreline is 1 500 km of which 300 km lie in Tanzania (Vanden Bossche and Bernacsek, 1990).
Although Tanzania has some 300 km of shoreline on the lake, the Nyasa area is remote from major centres of population, development activity has been minimal over the years, and the evolution of the fisheries has not been well documented. It does not appear at this stage that the development of the Nyasa fisheries is complicated by the question of territorial jurisdiction. As for the Mozambican fisheries, these have been severely affected by nearly two decades of war and fishing activity is reported to be limited.
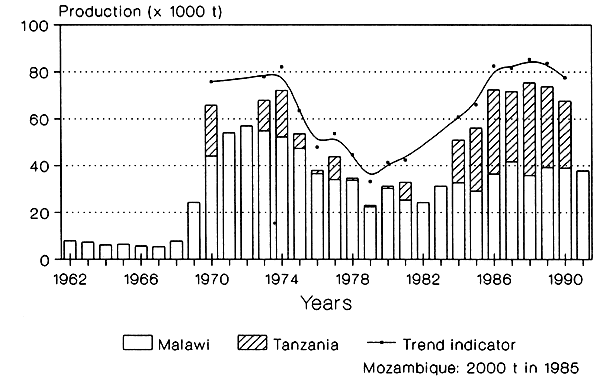
Annual production figures for Malawi date back to 1962 while for Mozambique, which shares around 48% of the lake, production estimates have been very scarce over all the years. It is generally accepted that the annual landing figures for the Tanzanian portion of the lake are overestimated, especially since 1984 (Figure 15). In the general trend indicator presented on Figure 15, Tanzanian estimates were consequently reduced significantly after 1984.
Main reported catches consist of Haplochromis spp. for the inshore areas and of Engraulicypris sardella for the open waters. Lake Malawi fisheries are diverse and involve the exploitation of many stocks in a variety of ways.
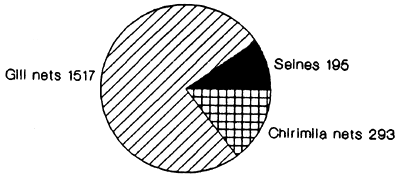
The artisanal fishery which produces an average of 25 000 t/yr, exploits both the inshore and offshore stocks and contributes about 90% of the total landed catch on the Malawi sector of the lake (Ssentongo and Nfamara, 1992). The main artisanal fishing gear are open water (‘chilimira’) seines, shore seines, gillnets and longlines which among them land approximately 70% of the annual total catch. A ‘Chambo’ (Oreochromis) ringnet fishery started in 1943. At present this ringnet fishery is closed to fishing during the nesting period of these species.
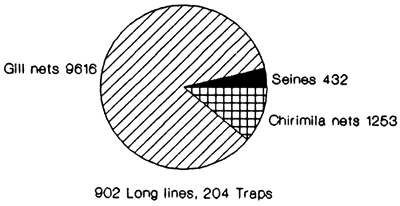
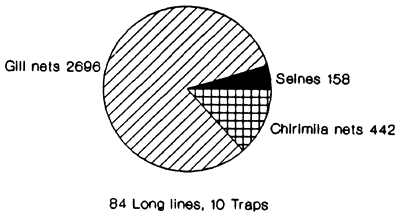
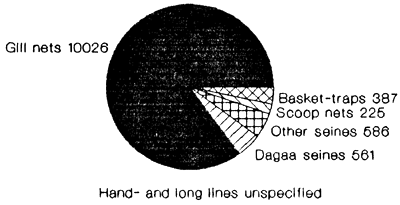
Most recent available information indicate that 22 000 artisanal fishermen operate on Lake Malawi and are distributed at about 600 fishing sites along the lake using approximately 10 000 fishing craft, 80% of which are dugout canoes, the rest being manually propelled (Alimoso et al., 1989). Further data on fishing effort are given in Figure 17.
The demersal trawl fishery is targeted at Lethrinops spp., Copadochromis, Bagridae and Clariidae. The commercial and semi-industrial pelagic fishery mainly exploits E. sardella. Trawling in the southern portion of the lake started in 1968. Over 160 species are caught by this technique, most of which are small cichlids. About 80 species belong to the genus Copadochromis and 30 species to the genus Lethrinops.
The semi-industrial fleet of Malawi was composed in 1991 of 26 vessels, of which 20 were regularly operating: 14 pair trawlers, 3 bottom water stern trawlers, 2 ringnetters, and one mid-water trawler (Magasa, 1992). Maldeco Fisheries Ltd., which started commercial trawling in 1968, remains the largest company and has significant onshore facilities. Pair trawlers are mostly owned by the private sector and operate at a much lower level of capitalization. Semi-industrial fishing is regulated through licensing by area and gear. Total fleet size has increased from 13 in 1976 to 26 in 1991 but, as noted by Turner and Mdaihli (1992), the number of boat-days has increased only by 21% and total catch has actually declined by 21%.
Total annual potential yield of Lake Malawi/Nyasa has been estimated to vary between 73 200 and 97 600 t, based on a productivity of 30–40 kg/ha/yr. Current commercial pelagic fish landings (mainly E. sardella) are estimated at an average of about 6 000 t/yr. This estimate is considered to be an underestimation due to the fact that night catches are not systematically recorded. This figure is to be compared with an estimated potential of 50 000 t, under favorable environmental conditions (Lewis and Tweddle, 1988).
For Malawi, data on species composition related to the Lake Malawi complex (Lake Malawi, Lake Malombe, Upper Shire River) are presented in Figure 16. These show a relative decline of total catch after the peak production figure of 45 300 t in 1987, and a significant change in species composition which reflects an increase in the catch of E. sardella and haplochromines as well as a significant decrease in the catch of other species, Chambo and catfish in particular. The latter phenomenon is believed to be the result of severe overexploitation of inshore stocks (FAO, 1992).
Figure 15 Production levels for Lake Malawi/Nyasa from 1962 to 1990
| Lake Malawi/Nyasa Malawi - Mozambique - Tanzania |
 |
| Trend indicator = catch + 10000 t |
Figure 16 Species composition for Lake Malawi-Complex, 1976–1990
| SPECIES COMPOSITION |
| L. MALAWI-MALOMBE-UPPER SHIRE RIVER |
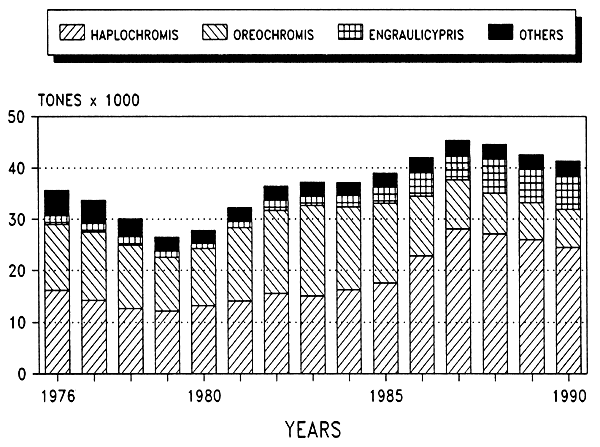 |
Source: FAO, 1992.
Figure 17 Lake Malawi/Nyasa: Results of recent frame surveys
| Lake Malawi, total, 1986 | Lake Malawi, S-E Arm, 1986 |
 |  |
| Source: GOPA (1987) | Source: GOPA (1987) |
| Lake Nyasa/Tanzania, 1989 | Lake Malawi, S-E Arm, 1990 |
 |  |
| Source: Fisheries Department, Dar-es-Salaam, 1989. | Source: Allmoso et al. (1990) |
| L. Malawi Total, 1986 | L. Nyasa/Tanzania, 1989 | L. Malawi S-E arm, 1986 | L. Malawi S-E arm, 1990 | ||||||
| Boats, total | 5755 | 2418 | 1930 | 1383 | |||||
| Out of order | 1151 | -- | 231 | -- | |||||
| Dugouts | 4490 | -- | 1017 | 701 | |||||
| Planked | 1265 | -- | 883 | 682 | |||||
| Engines | 413 | 10 | 231 | 127 | |||||
| Fishermen, total | 4698 | 5455 | 1181 | 702 | |||||
| - | Full time | 3358 | -- | 972 | -- | ||||
| - | Part time | 1340 | -- | 209 | -- | ||||
| Assistants | 14743 | -- | 6025 | 5586 | |||||
Source: as above.
Located at an altitude of 930 m, Lake Mweru has a total surface area of some 4 650 km2, of which 1 950 km2 (42%) lie in Zaire and 2 700 km2 (58%) in Zambia. Its maximum depth is 37 m with a mean of 10 m in the northern basin and some 3 m in the south. The shoreline is 350 km of which 140 km lies in Zaire (Vanden Bossche and Bernacsek, 1990).
The inflowing Luapula River is flanked on both sides of its course between the Johnson Falls and its point of discharge into Lake Mweru by an extensive floodplain (the Luapula Floodplain), covering 1 500 to 2 400 km2 with scattered permanent lagoons. This area is known as the Kifakula Depression (Vanden Bossche and Bernacsek, 1990).
Catches consist mainly of cichlids, in particular Oreochromis spp., Serranochromis spp., and Tylochromis spp. Additional fish taxa of importance are Mormyridae, Bagridae, Claracidae (Hydrocynus, Alestes), and Mochocidae (Synodontis).
The annual potential yield of Lake Mweru has been estimated to be around 12 000 t for the Zairian part and 16 000 t for the Zambian part. The entire Mweru-Luapula system would have an annual potential yield of 35 000–52 000 t (Vanden Bossche and Bernacsek, 1990).
Statistical time series for both Zaire and Zambia are available dating back to 1952. For Zaire, however, few data were collected during the 1960s when the production level is thought to have been rather high (Figure 18). The origin of the drastic decline in catches observed for both countries in 1981 is not documented, but is likely to be the result of the severe cholera outbreak which affected this region at this time. In general, Zairian statistics are believed to be rather unreliable. However, available data show an important decline in catches since the early 1970s. Semi-industrial fishing in Zairian water was to a large extent discontinued after the nationalization of the companies in the mid 1970s.
Since the early 1970s, annual production figures have been relatively stable at around 13 000 tonnes. This stability masks, however, a drastic change in species composition. In the 1950s and 1960s catches were dominated by O. macrochir and Labeo altivelis. Since then catches have been more multispecific, although composed largely of cichlids. Over the years, catch rates in the demersal gillnet fishery (by far the most important) have fallen drastically (Scullion, 1985), and it is only because of the subsequent development of a new pelagic fishery since the mid 1980s that total catch has been sustained. This fishery is based on the exploitation of the endemic species Poecilothrissa moeruensis, locally known as ‘chisense’. It is important to note that landings of chisense are still largely unreported in official data (Reynolds et al., 1991).
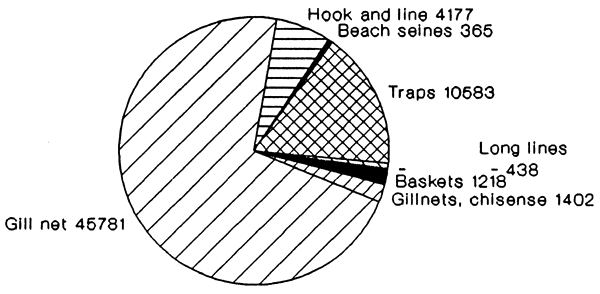
This fishery is especially important on the Zambian side of the lake where about 1 400 boats (chisense unit) were targeting this species in 1992, with estimated landings of about 15 000 t (Kapasa and van Zwieten, 1992). Results of a 1992 frame survey of Zambian fisheries are given in Figure 19 which also shows the importance of subsistence fishing activities in this fairly remote area. It is estimated that a very significant proportion of Zambian landings are exported to Zaire, perhaps over 50% (Reynolds et al., 1991).
Figure 18 Production levels for Lake Mweru from 1952 to 1989
| Lake Mweru Zambia - Zaire |
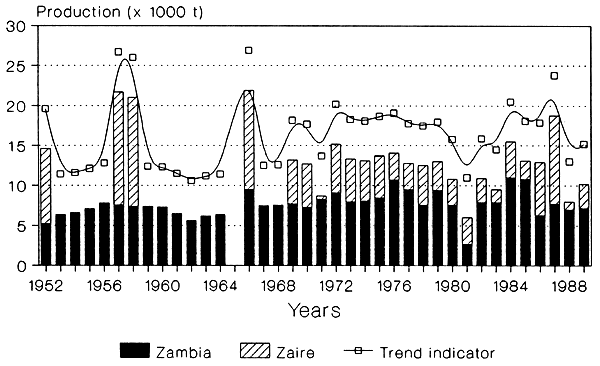 |
| Trend indicator = Catch + 5000 t |
Figure 19 Lake Mweru (Zambia): results of 1990 frame survey
| Fisheries Total, Zambia | |
| Boats total: 7707 • Dugouts: 3684 • Planked: 3955 • Fiber/Other: 67 Fishermen: 9436 | |
 | |
| Source: Aarnik et al. (1992) | |
| Chisense fishery | |
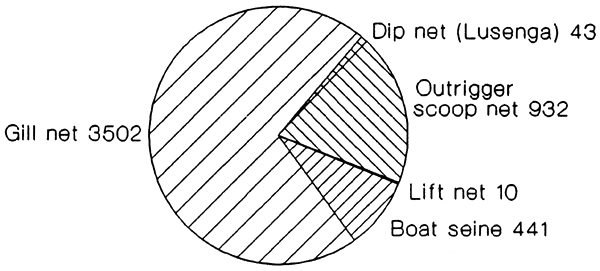 | |
| 1173 Fishermen 5787 Workers (crew) | 1735 Boats 156 Engines 116 Sails |
| Source: Kapasa & van Zwieten (1992) | |
Located at an altitude of 1 350 m, the total surface area of Lake Rweru (Rugwero in Rwanda) covers some 100 km2, of which 80 km2 lie in Burundi and 20 km2 in Rwanda. This shallow lake is part of the Upper Akagera Lakes Complex, and has a shoreline of some 76 km. The mean depth is around 2.1 m with a maximum of 3.9 m (Vanden Bossche and Bernacsek, 1990).
Catches consist mainly of Cichlidae, Cyprinidae, Clariidae and Mochocidae.
The annual potential yield of Lake Rweru has been estimated to be around 400–450 t, 320–360 t of which is for the Burundian part. This potential is limited because of former overfishing, lack of beaches for reproduction of the Cichlidae (Kiss, 1977) and use of habitat-destructive beach seines.
Statistical time series for both Burundi and Rwanda have always been rather scarce.
Total annual production of the Burundian part has been estimated at less than 300 to 350 t during the 1970s (Corsi et al., 1986) while the Rwandan part of the lake produced some 200 to 250 t/yr during the same period.
The number of fishermen for the entire lake was estimated not to exceed 150 in 1975/76 of which only 45 operated in Burundi (Kiss, 1977), most of them being also part-time farmers. On the Burundian side, since 1972, the number of fishermen has admittedly decreased, while on the Rwandan side their number increased in 1980–87. Recent estimates seem to indicate that some 160 fishermen were involved in the fisheries of Lake Rweru in 1991 (about 100 of which were from Burundi) using approximately 140 dugout canoes (about 80 in Burundi), (Maes et al., 1991b). These estimates are however thought to be rather low.
Major fishing techniques and methods used on this lake are beach seines (especially on the Burundi side), gillnets, and some hook and lines and traps. Recently some attempts have been made by the respective governments to replace the beach seines by the more selective and less destructive gillnets.
In general, it can be stated that information concerning the fisheries of Lake Rweru is rather poor and very sporadic. Also many fishery characteristics have been hastily quantified in the past and further efforts are to be made, both in Burundi and Rwanda, to improve the level of fishery knowledge for this lake. Historical statistics are given by Gréboval and Fryd (1993) for the period 1970–90. As for Lake Cohoha, the major commercial stocks (and Oreochromis spp. in particular) are believed to be largely overexploited. For both lakes haplochromines represent the major part of the biomass, but remain unexploited for lack of market.
Experimental fishing with setnets was conducted in 1981 and 1991, showing that the biomass has remained rather constant. Haplochromines represent about 20% of the biomass, significantly less than for Lake Cohoha. The average weight of O. niloticus decreased by 25% over the period (Maes et al., 1991b).
Lake Tanganyika waters (32 900 km2) are shared by four countries: Burundi, Tanzania, Zaire and Zambia. Burundi occupies the northeastern part of the lake (about 2 600 km2 or 8% of its total area) while Zambia occupies the southwestern part with some 2 000 km2 (6% of the total area). Tanzania and Zaire, the two largest riparian states, occupy respectively the eastern and western shores with respectively some 13 500 km2 and 14 800 km2 (41% and 45% of the total areas) (Vanden Bossche and Bernacsek, 1990).
The traditional fishery on Lake Tanganyika is carried out from single nonmotorized dugout canoes, using set gillnets, surrounding gillnets, beach seines, traps, hook and lines, and the traditional scoop nets locally known as ‘Lusenga’. This fishery has regained some local importance in the northern part of the lake (Burundi) during recent years and it is still commonly practised in Tanzania and Zaire.
The artisanal fishery is generally carried out from catamarans (and some rare trimarans) using liftnets. Additional motorized chasing canoes and light skiffs are often used by the individual units in order to increase the fishing power. In Zambia the definition of the artisanal fishery also includes the beach seine fishery. The lack of a standardized definition/classification around the lake renders any sound comparison of the information difficult.
The semi-industrial fishery is carried out from Mediterranean Greek-type steel vessels, using purse seines. Three to five light skiffs and an additional net-carrying vessel are also used in the operation.
The four main species which are the target of the artisanal and semi-industrial light fishery are: Stolothrissa tanganicae, Limnothrissa miodon, Luciolates stappersii and Lates spp. Fishing is not carried out during fullmoon periods and is therefore restricted to about 22 nights per month. The traditional fishery on the other hand is done during day time and targets the more coastal fish communities (cichlids, lungfishes, catfishes, etc.).
Production figures from the Burundian part of Lake Tanganyika have been on the increase since introduction of artisanal and semi-industrial fisheries in 1957 and 1954 respectively. The historical time series for this part of the lake have been revised and present a fair degree of completeness and reliability (Bellemans, 1991a and 1992). The information available from the Zairian part, on the other hand, is generally scarce, often incomplete and of dubious reliability. Some doubts can also be expressed concerning some of the Tanzanian data. The quality of the Zambian information has also been on the decline in the recent past.
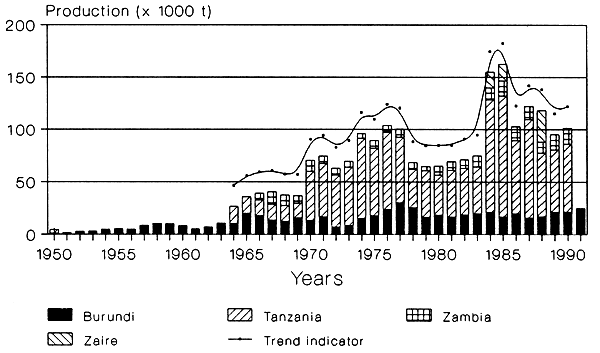
Global production figures for Burundi, Tanzania and Zambia fluctuated between 65 and 140 000 t/yr during the 1970s and 1980s, while during the 1950s and 1960s, it fluctuated between 10 and 40 000 t/yr (Figure 20). Recent as well as historical production levels for Zaire are hardly known and thus no global production figure for the entire lake can be estimated with any degree of confidence. However, it is generally accepted that the present production level for the Zairian part of the lake could be between 30 000 and 50 000 t/yr, which would provide a global estimated production level for the entire lake of some 120 000 to 150 000 t/yr.
Figure 20 Production levels for Lake Tanganyika from 1950 to 1990
| Lake Tanganyika Burundi - Tanzania - Zambia - Zaire |
 |
| Trend indicator = catch + 10000 t |
The evolution of landings seems to reflect changes in fishing effort as well as changes occurring in pelagic stock abundance. As far as the entire lake production is concerned, one observes between 1974 and 1978 an important increase in landings which mainly reflects the abundance of the pelagic stocks (Roest, 1988). Since 1985, however, the increase in landings is the direct result of the drastic increase in artisanal fishing effort as the industry benefited from a more favourable economic environment.
On the Zairian side, one observes a decrease in landings following independence and at the time of the “Zairianization” (1974–77). Indeed, the semi-industrial and industrial fishery, developed during the 1950s by the Greek community, represented at the beginning of the 1960s a substantial proportion of harvesting and trading capacities.
These fisheries declined after independence and have also been affected by the Shaba crisis (Kalemie and Moba as well as Lake Mweru in particular) and by the Zairianization which in two to three years resulted in the closure of most of the fishing companies. During the 1980s, the industrial fisheries did recover in the Kalemie area, absorbing some of the units previously operating from Uvira.
In Zambia, the increase of fishing effort in the coastal fishery led to a relative decrease in landings until 1974. The semi-industrial fishery developed from that date, partly thanks to the transfer of a part of the Zairian-Kalemie fleet to Mpulungu following the Zairianization. The artisanal fishery also experienced an increase in activity following the development of the Kapenta seine (draw net used in connection with a light skiff), and improved trade and processing facilities in the Mpulungu area.
In Burundi, the landings evolution essentially reflect the increase in artisanal and semi-industrial fishing activity during the late 1970s as well as the impact of three successive crises: the political crisis in 1972, the expulsion of the Zairian fishermen in 1978 and the change of government in 1987 (Gréboval and Maes, 1991).
The observed increase in the fishery in Tanzania during 1965–1975 corresponds to a real and important development of fishing effort. However, the lack of reliability of the statistical information system forces one to consider the production levels attained during the 1970s and mid 1980s with caution. The decrease in catches in the late 1970s is also the result of the economical crisis which Tanzania underwent during this period.
Gréboval and Fryd (1993) have compiled official estimates on production, species breakdown, fleet characteristics (number of reported artisanal and semi-industrial fishing units) and fishermen by country. This data base shows the Zairian information to be highly incomplete and when data are available, these concern only the northern part of the lake (Uvira area) and the Kalemie/Moba areas. Official information concerning fleet characteristics from Tanzania for 1980–87, and from Zambia for 1984–89, is also lacking, although some unpublished data are known to exist at the Fisheries Department in Dar-es-Salaam.
Figure 20 depicts the general trend observed in landings from Lake Tanganyika since 1950. This curve is based on available data and is drawn as an indicative curve on how production levels for the lake could possibly have evolved over the years. The spectacular increase in Tanzanian catches for 1984–85 may be the result of an overestimation.
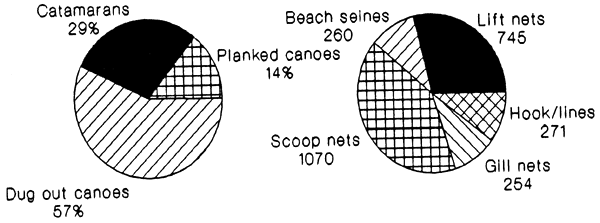
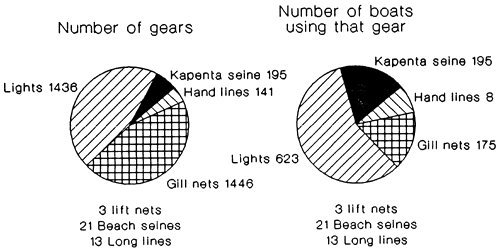
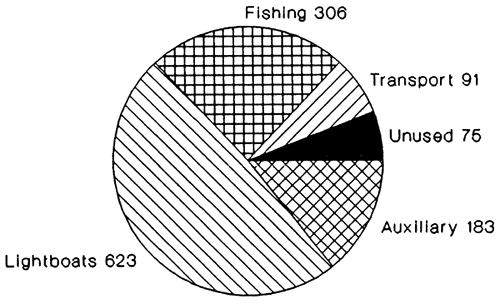
Concerning artisanal fishing effort, one notes a significant difference between the northern and southern parts of the lake. In the north, liftnet units prevail and are becoming increasingly efficient, e.g. the recent development of large size catamarans in Burundi, locally known as ‘Apollo’, and renewed interest in trimarans in Zaire. On the other hand, artisanal fishermen operating in the south rely extensively on beach and Kapenta seines. Figure 22 provides an indication of effort and gear use in selected parts of the lake based on recent frame surveys.
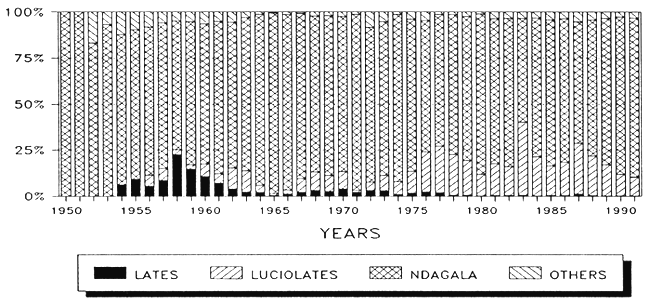
Since the early stages of the fishery and the progressive development of the exploitation rate, it has been observed, both in Burundi and in Zambia (Pearce, 1990), that some drastic changes have occurred in the species composition of the commercial pelagic catches. For Burundi, it can indeed be observed from Figure 21 that at the early stage of the development of the industry, large predators (Lates spp.) dominated landings of the semiindustrial fishery. This initial phase seemed to be followed by a period of increased landings of prey species (Ndagala = Stolothrissa tanganicae and Limnothrissa miodon) followed by increased landings of the second, but smaller predator (Luciolates stappersii). By further sustained increase in fishing pressure (increase in fleet size and performance), even this smaller predator seems to be progressively marginalized and most of the catch is now composed of Ndagala (Bellemans, 1992).
Figure 21 Lake Tanganyika: species composition in Burundi (1950 to 1991)
| LAKE TANGANYIKA - BURUNDI SPECIES COMPOSITION |
 |
In Zambia, one notes a decline of the prey population (L. miodon, and especially S. tanganicae), as well as a small decrease in the population of L. stappersii (Pearce, 1992). As in the case of Burundi, changes in relative abundance and catch composition have been ascribed to the effect of fishing effort but stock dynamics and species interactions remain largely unknown.
The results of recent frame surveys undertaken around Lake Tanganyika are given in Figure 22. It is estimated that about 37 000 fishermen are involved in the fisheries of Lake Tanganyika, operating close to 12 000 fishing units. The number of industrial vessels is estimated at 45, although those purse seiners are in variable conditions and not all in operation.
In the absence of any reliable catch data for Zaire, available fleet size data can be used to estimate recent catch levels. This is done below using hypothetical catch/boat information from Burundi (liftnets and traditional crafts) and Zambia (purse seiners).
| Boat type | Number of boats | Average catch per boat/year | Total (tonnes) |
| Traditional | 3 876 | 1.5–2.0 | 5 814–7 752 |
| Liftnets | 986 | 18–22 | 17 748–21 692 |
| Purse seiners | 16 | 200–300 | 3 200–4 800 |
| TOTAL | 4 878 | - | 26 762–34 244 |
Sources: Gréboval and Fryd (1993) for fleet data; Bellemans (1991c) and Pearce (1992) for catch rates.
This provides for an estimated catch of 27 000 to 34 000 tonnes. This result is comparable to previous estimates of about 30 000 tonnes by Mikkola and Lindquist (1989). On the other hand, recorded Tanzanian catches are twice as important, with both countries having a relatively similar fleet. This might indicate that Tanzanian catches are overestimated or that the above calculations inadequately reflect actual catch rates.
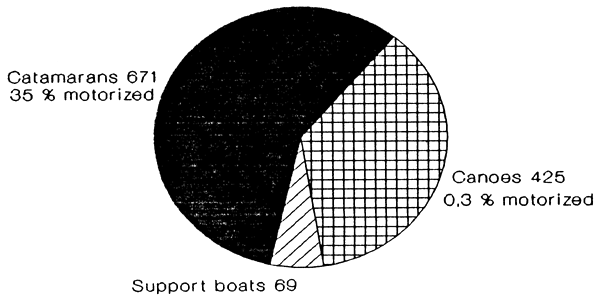
Figure 22 Lake Tanganyika: Results of recent frame surveys (Burundi)
| Burundi 1990 Distribution of fishing gear |
 |
| Distribution by boat types |
| Artisanal and traditional fleets |
 |
| Source: Bellemans (1991 B) |
Lake Tanganyika: Results of recent frame surveys (Zaire)
| Zaire (Northern Area: Uvira-Kazimia 1991) Distribution of fishing gear |
 |
| Artisanal boats |
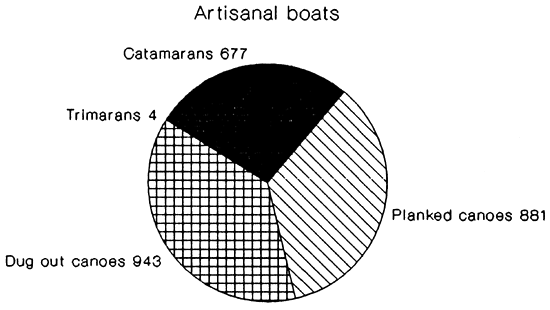 |
Number of boats accounts for 164 support boats 2341 fishing units recorded 62 boats are motorized |
| Source: Maes et al. (1991a) |
Lake Tanganyika: Results of recent frame surveys (Tanzania)
| TANZANIA: FRAME SURVEY RESULTS (1990–91) | ||||||||
| Source: Leendertse & Horemans (1991) Source: Chakraborty et al. (1992) | ||||||||
 | ||||||||
| Fishers total: | 12549 | # Fishing Units: | 2616 | # Active Boats: | 3577 | |||
| Kigoma Region: | 7725 | Kigoma Region: | 1459 | Kigoma Region: | 2134 | |||
| Rukwa Region: | 4825 | Rukwa Region: | 1157 | Rukwa Region: | 1443 | |||
| (Non-active: 420) | ||||||||
| TANZANIA: FRAME SURVEY RESULTS (1989) | ||||||||
| Source: Tanz. Fish. Dept. records | ||||||||
 | ||||||||
| Total number of boats: 3747 | ||||||||
| Number of engines: 241 | ||||||||
| Note: 90/91 gillnet data refer to gear; 89 data to # of nets | ||||||||
Lake Tanganyika: Results of recent frame surveys (Zambia)
| Zambia 1990 Distribution of fishing gear | |
 | |
| Use of artisanal boats | |
 | |
| Total number of boats: 1278 (of which 1261 are planked and 10 dug outs) | |
| Source: Pearce (1992) | Number of fishing units: 688 (as several boats are in use in connection with one gear) |
Located at an altitude of 406 m, the total surface area of Lake Turkana covers 7 570 km2. This lake has a shoreline of 917 km. The mean depth is 29.7 m with a maximum of 73 m (Vanden Bossche and Bernacsek, 1990).
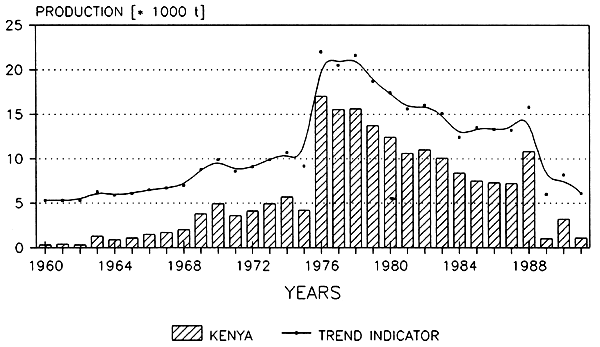
Annual potential yield of Lake Turkana has been estimated at 20 000 t (Balarin, 1985), up to 50–160 000 t (FAO/UNDP, 1966) and down to 5–10 000 t (Vanden Bossche and Bernacsek, 1990). This presumably reflects the influence of water level on productivity. Statistical data for Ethiopia are very scarce, while for Kenya statistics have been collected quite systematically but with fluctuating reliability. The 1988 production figure, for example, seems to be rather high.
Over the years, production has been strongly influenced by the water level of the lake. In recent years, Ferguson's Gulf has played a major role in the fisheries, sustaining a significant Oreochromis niloticus fishery. But the gulf dried up in the late 1980s, resulting in a drastic decrease in landings on the Kenyan side.
Total annual production of the Kenyan part has been estimated around 5 000 t during the 1960s and early 1970s; a tremendous increase was observed in 1976 when production reached as much as 17 000 t (Figure 23).
Figure 23 Production levels for Lake Turkana from 1960 to 1991
| LAKE TURKANA |
| KENYA |
 |
| TREND INDICATOR = CATCH + 5 000 t. |
During the late 1970s and 1980s, annual production data showed a steady downward trend which finally resulted in landings as low as 1 100 t in 1991. This downward trend observed during the 1980s was not only the result of the drying up of Ferguson's Gulf, but was also caused by the progressive transfer of fishing effort from Lake Turkana to Lake Victoria. Indeed, many fishermen operating on Lake Turkana are of the Luo tribe and originate from the Lake Victoria area, where they returned as fishing activities boomed on this lake in the 1980s.
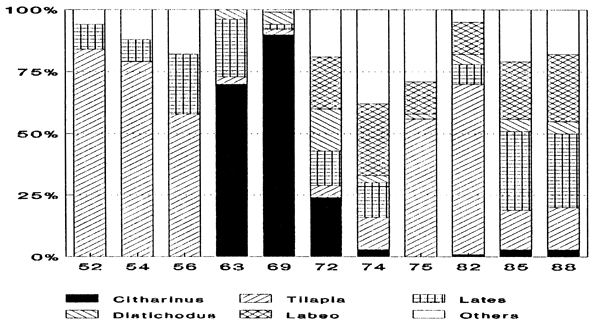
The number of fishermen for the entire lake was estimated to be around 1 500 in 1989, down from the estimated 7 000 in 1980–1982 (Kolding, 1989). Evolution of species composition since the early 1950s is given in Figure 24. One notes O. niloticus prevailing in the 1950s, as well as during the 1975–1983 period. Recent species composition estimates show the dominant species to be: Lates niloticus (30%), Labeo horie, and O. niloticus. In general, Figure 24 reflects a history of changes in fishing strategies and gear use, themselves related to changing ecological conditions and development project activities.
The number of artisanal fishing crafts in the Kenyan portion of lake Turkana rose steadily during the period covering the 1960s to the 1980s, from four units in 1962 to 45 units in 1970 and 264 units in 1980. During the 1980s, their number decreased steadily and only some 200 units remained in 1989.
Fishing is practised by three groups of fishermen: those organized in cooperatives, mostly under the framework of the Turkana Fisheries Cooperative Society created in 1968, and fishing essentially with gillnets and GRP canoes; the private artisanal fishermen, generally Luo immigrants from Lake Victoria, who fish with gillnets and beach seines with relatively larger planked canoes of 8/9 meters; and the subsistence ‘raft’ fishermen.
The fisheries resources of the lake thus remain largely underexploited, mostly due to its remoteness, and the relative failure of past development efforts as discussed by Kolding (1989).
Figure 24 Species composition for Lake Turkana, 1952–1988
| Lake Turkana |
| Landings Species Composition |
 |
| Source: Kolding (1989) |
Located at an altitude of 1 136 m, the total surface area of Lake Victoria covers 68 800 km2 (6% or 4 100 km2 in Kenya, 49% or 33 700 km2 in Tanzania and 45% or 31 000 km2 in Uganda). This large shallow lake has a shoreline of 3 440 km. The mean depth is around 40 m with a maximum of 84 m (Vanden Bossche and Bernacsek, 1990).
Endemic species of commercial interest are: Oreochromis esculentus, Bagrus dormac, Clarias mossambicus, Protopterus aethiopicus, Schilbe mystus, and Synodontis sp. Other species have been introduced into Lake Victoria: Oreochromis niloticus, O. leucostictus, Tilapia zillii, T. rendalli (in the 1950s), and Lates niloticus (in the late 1950s-early 1960s).
During the 1960s and 1970s, Haplochromis species constituted an estimated 80% of the lake's fish biomass. In the late 1970s and the 1980s, the Nile perch Lates niloticus population increased dramatically, to the detriment mainly of the Haplochromis population. It is anticipated (and some primary indications have already been observed) that the Nile perch population will decrease, following increased fishing pressure on this stock and possibly because of reduced abundance of related prey stocks.
The annual potential yield of the Ugandan part of the lake has been estimated to reach 14.5 kg/ha/yr or some 45 000 t/yr. For the Tanzanian part, the estimated annual potential yield ranged from 63 000 to 100 000 t, while the Kenyan potential is reported to range from 25 000 to 45 000 t (Vanden Bossche and Bernacsek, 1990). However, these estimates refer to the pre-Nile perch regime and may now be of little relevance.
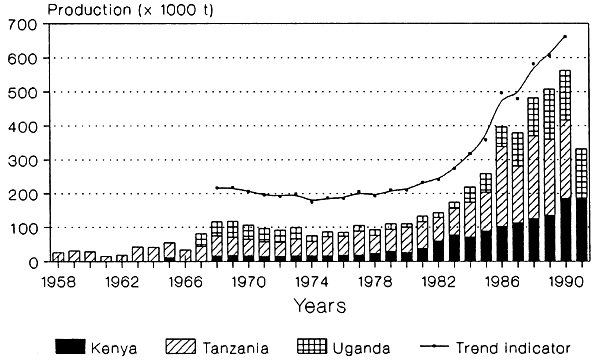
One observes from Figure 25 that the evolution of landings in each of the riparian countries follows a similar trend. After an initial expansion period during the 1950s and early 1960s, a stagnation of the production is observed until 1980. The relative stability of production during this period overshadows, however, the rather systematic overexploitation of high-value species and increased reliance on the harvesting of species with much lower market values (Haplochromis and Rastrineobola argentea).
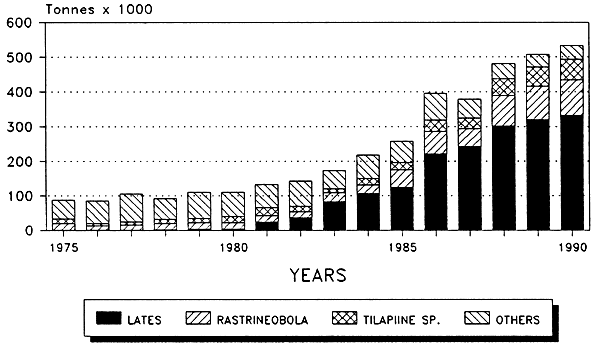
From 1979 to 1981, one observes in the three countries a considerable increase in catches of Lates niloticus. The fundamental biological changes which then took place in the lake have rapidly affected all the stocks and resulted in a spectacular increase in landings (mainly Lates niloticus, O. niloticus, and then R. argentea). Total landings indeed reach some 500 000 t at the end of the 1980s. This level of production represents about five times the mean production level observed during the 1970s. Although not necessarily sustainable, this evolution has brought huge benefits to the fisherfolks of the three riparian states (Reynolds et al., in press).
Gréboval and Fryd (1993) have compiled official production estimates over the last three decades, as well as the evolution of species breakdown and fleet characteristics. The rapid expansion of fishing effort since 1980 is to be noted, and it is estimated that about 105 000 fishermen and 21 800 fishing crafts (predominantly wooden canoes) are now involved in fishing operations on the lake.
Figure 26, depicting the evolution of landings from Lake Victoria from 1975 to 1990, indicates that important changes have occurred in the species composition. Landings of Lates niloticus became substantial in 1981 and increased dramatically thereafter. But recent trends, under the effect of increased fishing pressure on that species, seem to indicate a stabilization of catches in 1989/90. Landings of Rastrineobola have also been on the increase since the late 1980s and present trends seem to indicate that further increase in catches can be expected in the future. Landings of O. niloticus have increased as well over the last decade, while landings of other cichlids and other species of commercial importance decreased quite drastically. Recent trends seem to indicate that catches of other species are increasing again in areas where predation from Lates niloticus has been reduced through heavy fishing pressure, e.g. in the Nyanza Gulf.
Figure 25 Lake Victoria: Production by country, 1958–1991
| Lake Victoria Kenya - Tanzania - Uganda |
 |
| Trend indicator = catch + 100000 t |
Figure 26 Lake Victoria: Production by species group, 1975–1990
| LAKE VICTORIA LANDING EVOLUTION 1975–1990 |
 |
The above changes in species composition are presented in percentage terms in Figure 27 for the period 1975–1990. Nile perch represents about 60% of the catch since 1987. Figure 28 presents the changes in distribution of the catches in 1970, 1980 and 1990 for the three riparian states. The 1970 figures do relate to some extent to the countries' share of coastline. In 1980, Kenya is seen to have readily adjusted its fishing effort and marketing structure to the new fisheries. A similar development occurred thereafter in the other two countries while the Kenyan portion of the lake reached maximum production, with many signs of overexploitation in the Nyanza Gulf in particular.
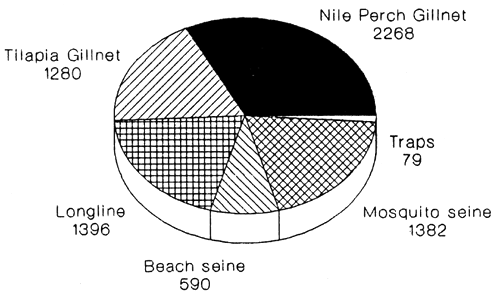
Basic data on fishing effort and gear distribution are given in Figure 29. This information is based on frame surveys undertaken recently in all three countries.
A compilation of basic data undertaken recently provides further indications on the evolution of the fisheries in each of the three countries concerned (Gréboval and Mannini, 1992). It is shown that exports of Nile perch are expanding rapidly with many plants still under construction in Uganda and Tanzania. As Nile perch production is likely to decrease in the near future, increased competition between the local and export markets is becoming a major issue. For example, Nile perch and tilapia were sold in Kenya at almost the same ex-vessel price in 1991, whereas tilapia prices were over 100% higher until 1989. Other areas of concern are reduced oxygen level and other signs of environmental degradation, and the recent proliferation of water hyacinth, Eichornia crassipes.
Figure 27 Lake Victoria species composition in percentage, 1975–1990
| LAKE VICTORIA SPECIES COMPOSITION |
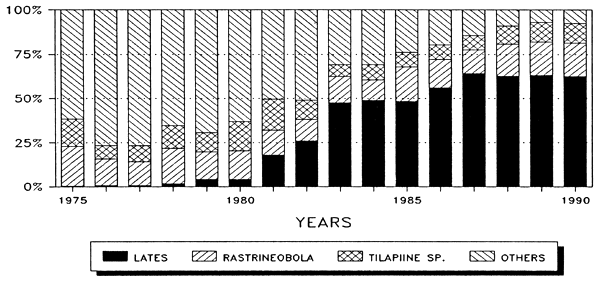 |
Figure 28 Catch distribution by country in 1970–1980–1990
| L. VICTORIA CATCH/COUNTRY 1970–1980–1990 |
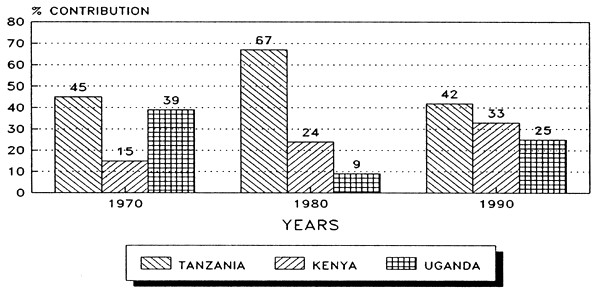 |
Figure 29 Lake Victoria: Results of recent frame surveys
Basic effort data (1990–1991):
| Dugout canoes | Planked boats | Motorized boats (%) | Number of fishermen | |||
| Kenya | 46 | 6176 | 3.4 | 24000 (app.) | ||
| Tanzania | 7757 | 2.6 | 29816 | |||
| Uganda | 2242 | 5758 | 14.4 | 30000 (App.) |
Source: Hoekstra et al. (1991), Fisheries Department, Dar-es-Salaam (1989), Tumwebaze and Coenen (1991).
Gear distribution by country: (Kenya)
| Kenya, 1991 |
 |
| Source: Hoekstra et al. (1991) |
Lake Victoria: Results of recent frame surveys
Gear distribution by country: (Tanzania, Uganda)
| Tanzania, 1989 |
 |
| Source: Fisheries Department, Dar-es-Salaam |
| Uganda, 1991 |
 |
| Source: Reynolds & Kitakule (1991) |
Note: Number of gillnets refers to gear in Kenya and to pieces of net (generally 100 yds) in Tanzania.