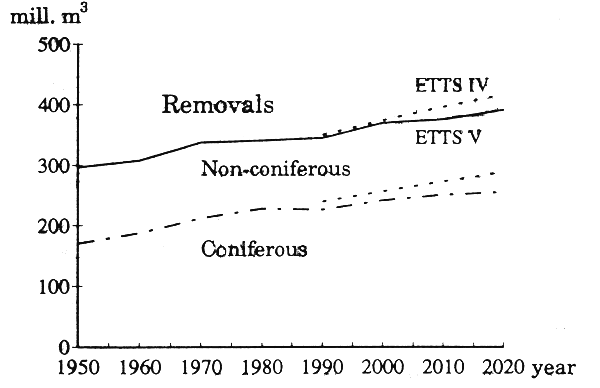
The rise in total European removals is expected to continue in future (Fig. 1). ETTS IV study was very successful in forecasting the level of total removals in 1980's. In 1990's and in the following decades ETTS IV assumed higher increase in removals for the same periods than ETTS V.
EUROPE
removals u.b. excl. Baltic states

Figure 1. Past and projected levels of removals.
A grouping of countries is necessary in a multi-country study in order to make the results useful for different countries and regions. Nevertheless, any grouping is unsatisfactory from one point of view or another, and inevitably conceals interesting developments at country or region level. There is no need for further discussion of the country forecasts here, except to note that, while the Nordic countries and Central Europe are homogenous groups in terms of their forestry, the same is not the case in the other groups.
The country groups are following:
Baltic countries: Estonia, Latvia and Lithuania;
Central Europe: Austria, Switzerland;
East Europe; Bulgaria, Czech Republic, Hungary, Poland, Romania and Slovakia;
EU: Belgium, Denmark, France, Germany, Greece, Ireland, Italy, Luxembourg, Netherlands, Portugal,
Spain and United Kingdom;
Nordic countries: Finland, Norway and Sweden;
South-East Europe: Albania, Croatia, Israel, Turkey, and other parts of former Yugoslavia.
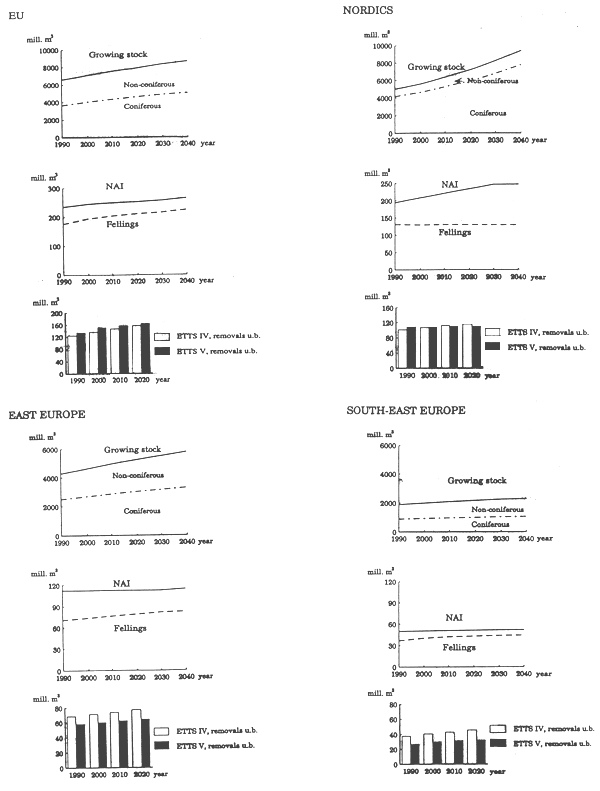
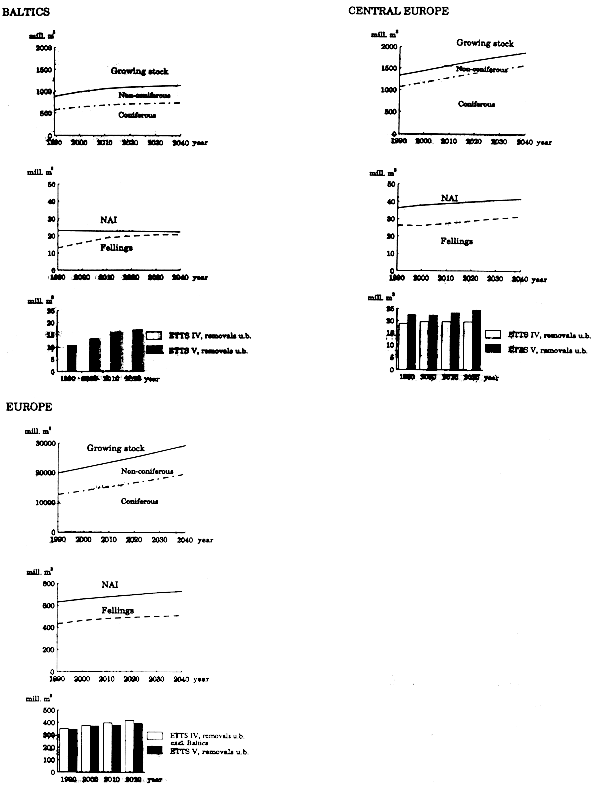
In Figures 2 and 3 development of growing stock, divided into coniferous and non-coniferous shares, net annual increment(NAI) and fellings are presented and ETTS IV and ETTS V forecasts of removals are compared.
Trends and forecasts of removals are shown in table 1 for country groups. In volume terms, the country groups expecting the largest growth in removals is Baltic countries. In France, Ireland and UK are all expecting higher removals in future. The same development can be seen in Portugal and Spain too, but in Spain the forecast level of removals is lower than that for the same period in ETTS IV. In Nordic countries removals will stay at same level as they are now. Share of coniferous and broadleaved species in removals vary quite a lot depending on country's location, but they stay nearly constant in time. Share of coniferous species range from 83 percent in Nordic countries to 34 in South-East Europe in 1990.
| 1990 | 2000 | 2010 | 2020 | 2030 | 2040 | |
| Baltic | 10.6 | 13.3 | 16.0 | 17.0 | 17.6 | 17.7 |
| countries | ||||||
| Central | 22.3 | 22.3 | 23.3 | 24.5 | 25.7 | 26.9 |
| Europe | ||||||
| East Europe | 58.1 | 60.3 | 62.5 | 64.3 | 66.5 | 67.2 |
| EU | 134.9 | 150.4 | 157.8 | 163.8 | 168.0 | 174.9 |
| Nordic | 108.1 | 108.6 | 109.5 | 109.6 | 109.7 | 109.8 |
| countries | ||||||
| South-East | 26.7 | 29.5 | 31.5 | 32.3 | 33.1 | 34.2 |
| Europe | ||||||
| Europe | 360.8 | 384.5 | 400.7 | 411.4 | 420.6 | 430.7 |

Figure 2. Growing stock, divided into coniferous and non-coniferous, net annual increment(NAI), fellings and ETTS IV and ETTS V forecasts of removals.

Figure 3. Growing stock, divided into coniferous and non-coniferous, net annual increment(NAI), fellings and ETTS IV and ETTS V forecasts of removals.
The trend towards higher removals/hectare seems to be quite clear. The explanation is, that when growing stock per hectare is large removals per hectare will also be great. Due to forest structure removals per hectare will increase proportionally more in Ireland, UK and Baltic countries than elsewhere.
| 1990 | 2000 | 2010 | 2020 | 2030 | 2040 | |
| Baltic | 1.85 | 2.31 | 2.77 | 2.93 | 3.04 | 3.05 |
| countries | ||||||
| Central | 4.93 | 4.90 | 5.11 | 5.34 | 5.58 | 5.84 |
| Europe | ||||||
| East Europe | 2.49 | 2.53 | 2.60 | 2.65 | 2.71 | 2.71 |
| EU | 3.12 | 3.37 | 3.44 | 3.50 | 3.53 | 3.61 |
| Nordic | 2.24 | 2.25 | 2.27 | 2.27 | 2.28 | 2.28 |
| countries | ||||||
| South-East | 1.74 | 1.91 | 2.04 | 2.09 | 2.14 | 2.21 |
| Europe | ||||||
| Europe | 2.57 | 2.70 | 2.78 | 2.84 | 2.88 | 2.92 |
Europe's net annual increment (NAI) on exploitable closed forest area around 1990 of 650 mill.m3 overbark is forecast to rise to 677 mill.m3 by 2000, which is nearly 140 mill.m3 more than ETTS IV estimate for same year. Increment will stay in excess of fellings, with the result that growing stock will continue to expand in Europe. Only in Sweden will age class structure be in 2030's such that net annual increment will tend to diminish due to old growth forests. In the Czech Republic, Poland and Slovakia the reason for diminishing increment is forest dieback. In countries with large plantation programmes in recent decades the felling/net annual increment (NAI) ratio will increase when more plantations reach maturity. About one third of net annual increment takes place in Nordic countries and in EU.
| 1990 | 2000 | 2010 | 2020 | 2030 | 2040 | |
| Baltic | 23.1 | 22.8 | 22.7 | 22.6 | 22.5 | 22.3 |
| countries | ||||||
| Central | 36.3 | 37.9 | 38.9 | 39.9 | 40.9 | 41.9 |
| Europe | ||||||
| East Europe | 112.5 | 112.3 | 112.6 | 112.5 | 112.7 | 114.4 |
| EU | 214.5 | 226.4 | 231.7 | 235.9 | 241.9 | 249.8 |
| Nordic | 193.6 | 207.9 | 220.6 | 233.7 | 246.5 | 247.5 |
| countries | ||||||
| South-East | 49.8 | 50.3 | 51.0 | 51.5 | 51.8 | 52.3 |
| Europe | ||||||
| Europe | 629.8 | 657.6 | 677.5 | 696.2 | 716.3 | 728.2 |
| 1990 | 2000 | 2010 | 2020 | 2030 | 2040 | |
| Baltic | 56 | 69 | 83 | 88 | 92 | 93 |
| countries | ||||||
| Central | 72 | 69 | 70 | 72 | 74 | 76 |
| Europe | ||||||
| East Europe | 63 | 66 | 68 | 70 | 72 | 72 |
| EU | 75 | 79 | 81 | 83 | 84 | 84 |
| Nordic | 68 | 62 | 59 | 56 | 53 | 52 |
| countries | ||||||
| South-East | 74 | 80 | 83 | 84 | 85 | 85 |
| Europe | ||||||
| Europe | 70 | 71 | 72 | 72 | 71 | 72 |
| 1990 | 2000 | 2010 | 2020 | 2030 | 2040 | |
| Baltic | 4.01 | 3.95 | 3.92 | 3.90 | 3.87 | 3.84 |
| countries | ||||||
| Central | 8.02 | 8.34 | 8.53 | 8.71 | 8.90 | 9.08 |
| Europe | ||||||
| Eastern | 4.82 | 4.71 | 4.68 | 4.63 | 4.59 | 4.62 |
| Europe | ||||||
| EU | 5.44 | 5.50 | 5.45 | 5.40 | 5.40 | 5.47 |
| Nordic | 4.02 | 4.31 | 4.58 | 4.85 | 5.11 | 5.14 |
| countries | ||||||
| Southern | 3.24 | 3.26 | 3.31 | 3.34 | 3.36 | 3.39 |
| Europe | ||||||
| Europe | 4.63 | 4.75 | 4.83 | 4.91 | 5.00 | 5.05 |
Evolution of growing stock is to some extent the result or consequence of felling and increment forecasts. It is showing how big growing stock will be if supply of roundwood and net annual increment both are developing according to scenarios.
| 1990 | 2000 | 2010 | 2020 | 2030 | 2040 | |
| Baltic | 879.4 | 981.7 | 1051.5 | 1089.9 | 1117.9 | 1136.8 |
| countries | ||||||
| Central | 1332.0 | 1441.4 | 1558.9 | 1672.4 | 1781.4 | 1885.4 |
| Europe | ||||||
| East Europe | 4272.5 | 4614.7 | 4942.3 | 5236.1 | 5505.3 | 5785.3 |
| EU | 6608.8 | 7119.8 | 7580.1 | 7944.7 | 8367.9 | 8710.1 |
| Nordic | 4976.9 | 5607.1 | 6396.2 | 7307.3 | 8355.7 | 9539.2 |
| countries | ||||||
| South-East | 1898.1 | 1997.1 | 2087.6 | 2170.8 | 2251.0 | 2301.3 |
| Europe | ||||||
| Europe | 19967.8 | 21761.8 | 23616.7 | 25421.2 | 27379.1 | 29358.1 |
Growing stock per hectare is increasing in every subgroup. In Europe average growing stock per hectare is increasing by almost 1 cubic meter annually. In Central Europe and South-East Europe the increase is somewhat smaller.
| 1990 | 2000 | 2010 | 2020 | 2030 | 2040 | |
| Baltic | 152.55 | 169.90 | 181.67 | 187.98 | 192.80 | 196.07 |
| countries | ||||||
| Central | 294.30 | 316.99 | 341.64 | 365.15 | 387.51 | 408.63 |
| Europe | ||||||
| East Europe | 183.09 | 193.72 | 205.42 | 215.55 | 224.38 | 233.44 |
| EU | 153.00 | 159.27 | 165.12 | 169.93 | 175.76 | 179.51 |
| Nordic | 103.26 | 116.34 | 132.71 | 151.61 | 173.37 | 197.92 |
| countries | ||||||
| South-East | 123.49 | 129.51 | 135.30 | 140.58 | 145.77 | 149.03 |
| Europe | ||||||
| Europe | 142.23 | 152.75 | 164.07 | 175.24 | 187.30 | 199.23 |
Forest area will increase steadily. In every country at least some agricultural land is expected to be shifted into forests due to changes in agricultural policies. Because so many countries were unable to give quantitative information about afforestation areas, the forecast of forest area in table 8 might be too conservative.
| 1990 | 2000 | 2010 | 2020 | 2030 | 2040 | |
| Baltic | 5765 | 5778 | 5788 | 5798 | 5798 | 5798 |
| countries | ||||||
| Central | 4526 | 4547 | 4563 | 4580 | 4597 | 4614 |
| Europe | ||||||
| East Europe | 23336 | 23821 | 24059 | 24292 | 24535 | 24783 |
| EU | 43196 | 44703 | 45906 | 46754 | 47611 | 48522 |
| Nordic | 48197 | 48197 | 48197 | 48197 | 48197 | 48197 |
| countries | ||||||
| South-East | 15371 | 15421 | 15430 | 15442 | 15442 | 15442 |
| Europe | ||||||
| Europe | 140391 | 142467 | 143943 | 145063 | 146180 | 147356 |