![]()
![]()
![]()
1.1 The basic principle of site selection for netcage farming is to select an area where the conditions
favour the setting up and maintenance of farm structure and
are cotiral to the growth and survival of the selected farm species and convenient to farming operation.
1.2 Although a floating farm has the advantage of being movacle and can be re-sited when conditions become unfavourable, it is important to carefully select a suitable site for farming at the planning stage in order to minimize the costs of investment and coeration, increase fish production and maximize returns. The major criteria for site selection are discussed below.
2.1 Exposure
The farm should be sited in sheltered waters protected from strong winds and waves. Suitable sites include protected bays, estuaries, lagoons and inland seas. The conditions in the area should be calm and the height of waves should preferably be less than 0.5m and not more than 1m. Strong wave action could be nazardous to large raft structures and therefore restrict the size of the farm structure.
2.2 Depth
The depth of water should be at least 2m more than that of the netcages. This is to facilitate water flow below the netcage, avoid accumulation of uneaten food, faeces and debris in the net bottom. The depth of a netcage is about 2–3m. The selected site for fish farming in floating netcages should be at least 5m.
In areas with a tidal current. this minimum depth (D) refer to the depth at lowest low water during spring tide, and is calculated below.
| D | = | M - T + H |
| Where M | = | Measured depth |
| T | = | Tidal height at the time when M is taken |
| H | = | Minimum tidal height, i.e. the tidal height at lowest low water coring spring tide |
On the other hand, the maximum depth of the selected site should preferably be less than 20m. This is because in deeper waters, longer anchoring ropes and heavier anchor blocks are required for fixing the farm structure to the sea bed. This would of course increase the construction and maintenance cost of the anchoring system.
The maximum depth (D') refers to the depth at highest high water during spring tide and it is calculated as follows:
D' = M - T + H'
where H' is the maximum tidal height, i.e. the tidal height at highest high water during spring tide. For example, the minimum and maximum tidal heights in the East Johore Strait are 0.1m below (H = - 0.1m) and 3.6m above (H' = 3.6m) the chart datum respectively. If the depth of a survey area measured at 1.2m tidal height (T) is 7.5m (M), then the minimum depth (D) and maximum depth (D') in the surveyed area are 6.2m and 9.9m respectively.
From the above, it can be seen that for netcage fish farming, the maximum and minimum depth of the selected site should fall in the range of 5 to 20m.
3.1 Current movement
The meximal current of the selected site should ideally be less than 30cm/sec and should not exceed 100cm/sec.
Strong currents have the following adverse effects on fish farming in flcating netcages:-
it causes excessive strain on the raft enchoring system;
it distorts the netcages and therefore limits the number of fish that can be stocked (stocking density);
it affects the growth of fish since fish do not do well under strong current conditions as they have to swim against the current to maintain their position. This results in the waste of energy;
it sweeps away some of the feeds and reduces feeding efficiency and causes feed wastage.
In addition to current strength, the direction of current flow is also important to the positioning of the farm structure. In order to minimize the strain on the anchoring system as a result of current flow, the farm structure should be positioned in a direction parallel to that of maximal current movement.
In areas subject to tidal influence, the current velocity varies greatly with the tidal condition. It is therefore important to have prior knowledge of the pattern of current movement in the area in order to determine the most suitable time for measuring maximal current velocity. For example, the current movement in the East Johore Strait is found to be closely related to the tidal condition. The flood current flows inwards in a direction almost parallel to the coastline during rising tice while the ebb current flows in the ocosite direction during felling tide. The reversel of current from flood to ebb is about in phase with high water, while that from ebb to flood occurs at about one bour before the low water (Figure V.1). Current velocity is generally stronger at felling tide then at rising tide.
The strongest current occurs at 1–2 hrs after the peak of high water during spring tide, which is the most appropriate time for measuring maximal current velocity in the Strait. To minimize strain on the anchoring system, a farm structure located in the Strait should be positioned in the direction parallel to the coastline.
3.2 Turbidity
Farms should be sited in area with clear water. Suspended solids should preferably be less than 5 mg/1 and should not exceed 10 mg/1. Turbid water is not suitable for fish farming because:
the silt particles in turbid water would contribute to netcage fouling. When deposited on the netcages, they accelerate fouling by serving as a substrate for the growth of fouling organisms.
it affects the sighting of feeds by fish during feeding. It has been observed that fish do not feed well when water becomes turbid;
the silt particles in large amounts, clog fish gills causing fish mortalities resulting from asphyxiation.
3.3 Water temperature
a Water temperature may restrict the type of fish suitable for farming. For example, the cold water species may not perform well in tropical waters. In the Johore Straits, the mean water temperatures vary within the range of 27-31°C. This is suitable for the farming of all tropical marine species.
4.1 The floating fish farm should be sited in an area with good water quality. The selected site should be away from sources of domestic, agricultural and industrial pollution. In areas with tidal fluctuation, the water quality varies with the tidal condition. It is thus necessary to have some prior knowledge of the fluctuation of water quality with tide to identify the time of worst water quality. In the East Johore Straits, water sampling is conducted at low water during neao tide, during which water movement in the area is minimum and the water quality is at its poorest.
4.2 Dissolved oxygen
The dissolved oxygen should preferably be 5ppm or more and should never be less than 4ppm. In general, pelagic fish such as rabbitfish and snapper require higher oxygen levels than demersal species like grouper. To ensure high oxygen, it is important to maintain the netcages in clean condition so as to facilitate sufficient circulation of water through the net.
4.3 Ammonia-nitrogen
The procedures for determining ammonia-nitrogen in water samples is covered in Practical V/1.
4.4 Salinity
Salinity of water at the selected site should be optimal to the selected fish species. For example, the optimal salinity is 15‰ or more for grouper, 25‰ or more for rabbitfish and snapper and 32‰ or less for seabass. The annual range of mean salinity in the East Johore Strait is 26–31‰, which is optimal for farming of all the abovementioned species.
4.5 Hydrogen ion index (pH)
The hydrogen ion index (pH) of coastal water varies with salinity and phytoplankton population. pH increases as the salinity or phytoplankton density increases. The pH of the selected site should preferably be in the range of 7.8–8.3 and should not exceed 8.5. It is important to measure the pH immediately after the water is sampled. Any delay in pH measurement would yield unreliable result.
4.6 Organic load
Chemical oxygen demand (COD) is an useful indicator of the extent of organic load in water. The COD of water at selected site should be 3 mg/1 or less. Area with high organic load has higher rate of bacterial infection in fish and lower oxygen level in water. The procedure for measuring COD is covered in Practical V/1.
4.7 Heavy metals
High heavy metals in water would render cultured fish unfit for human consumption because they accumulate with the fish. The important heavy metals and the acceptable safe limits in water for fish farming are given in Table V/1.
Table V/1
| Parameter | Acceptable standard | ||
| 1. | Topographical criteria | ||
| 1.1 | Height of wave (m) | < 1 | |
| 1.2 | Depth (m) | 5–20 | |
| 2. | Physical criteria | ||
| 2.1 | Current velocity | < 100 | |
| (cm/sec) | |||
| 2.2 | Suspended solids | < 10 | |
| (mg/l) | |||
| 2.3 | Water temperature (°C)* | 27–31 | |
| 3. | Chemical criteria | ||
| 3.1 | Dissolved oxygen (mg/1) | > 4 | |
| 3.2 | Salinity (%0)* | 26–31 | |
| 3.3 | Hydrogen ion index, pH* | 7.8–8.5 | |
| 3.4 | Chemical oxygen demand | < 3 | |
| 3.5 | Ammonia-nitrogen (NH3-N) | < 0.5 | |
| 3.6 | Heavy metal (ppm)** | ||
| Manganese (Mn) | < 1.0 | ||
| Iron (Fe) | < 1.0 | ||
| Chromium (Cr) | < 1.0 | ||
| Tin (Sn) | <1.0 | ||
| Lead (Pb) | <0.1 | ||
| Nickel (Ni) | <0.1 | ||
| Zinc (Zn) | <0.1 | ||
| Aluminium (Al) | <0.1 | ||
| Copper (Cu) | <0.01 | ||
| Cadmium (Cd) | <0.03 | ||
| Mercury (Hg) | <0.004 | ||
* Applicable to tropical marine species only.
** Pased on Japanese standards for fisheries(Yokokawa, 1982).
5. Biological criteria
5.1 Fouling organisms
Excessive growth of fouling organisms on netcages would limit water circulation. This lowers the dissolved oxygen content of water in the netcage.
Net fouling is primarily caused by silt particles in water. These particles also act as a substrate for the growth of fouling organisms. In the East Johore Strait, fouling matter collected by a 2 x 2 x 2m netcage of 1.3cm mesh size after two months of immersion is about 90 kg/netcage.
The fouling matter consists mainly of silt particles (58%) and the brown mussel, Modiolus sp. (38%). Other fouling organisms include the green mussel, marine worms, tunicates and algae. The rate of fouling varies in different locations. Fouling is generally more rapid in areas with weak current and turbid water. In such areas, netcages would have to be washed more frequently to facilitate water exchange. To minimize maintenance cost, a floating farm should preferably be sited in an area with condition that are unfavorable to the growth of fouling organisms. These conditions are relatively clear water, sufficient water flow, low nutrient and organic loads.
5.2 Phytoplankton
Excessive blooms of phytoplankton, especially the dinoflagellates, would clog fish gills and cause asphyxiation, leading to high mortalities. The factors that are conducive to phytoplankton blooms are stagnant hydrogical conditions, and high nutrient and organic loads. These should be avoided when selecting fish farming site.
6. Accessibility
The selected site should not be too far away from shore. It should be located close to a jetty, which is preferably accessible by road. There should be a reliable fresh water source near the jetty, as fresh water is needed for daily life and washing of certain farm equipment. Good accessibility would facilitate distribution of farm produce, transportation of feed and fish stocks, fuel, farm equipment, supplies and other necessities. Good accessibility also facilitate proper management of the farm.
1. Objective
1.1 To determine ammonia-nitrogen in water samples.
1.2 To apply such data in site identification for netcage farming.
2. Procedure
2.1 Preparation of reagents
De-ionized water (ammonia-free water)
Remove the ammonia from distilled water by passing it through a glass tubing (1-2.5 cm in diameter e.g. the conventional 25-ml burette) containing a 25 cm column of cation exchange resin (bydrogen form). The de-ionized water should preferably by prepared just before use and stored in a tightly stoppered glass bottle.
Phenol-alconol solution
Dissolve 5 g of phenol C6H5 OH (A.R.) in 50 ml of 95% v/v ethvl alcohol C2H5OH.
Sodium nitrcorusside solution
Dissolve 1 g of sodium nitroprusside Na2Fe(CN) 5NO.2H2O (A.R.) in 200 ml of de-ionized water (a). Store in an amber glass bottle; the solution is stable for about one month.
Alkaline citrate reagent
Dissolve 40 g of tri-sodium citrate C3H4OH (COONa)3.2H2O (A.R.) and 2 g of sodium hydroxide NaOH (A.R.) in 200 ml of de-ionized water (a).
Sodium hypochlorite solution
Use a commercial hypochlorite solution NaOCl (e.g.>1.5N Chlorox). The solution decomposes slowly and its strength should be monitored periodically as follows:-
Dissolve 12.5 g of sodium thiouslphate Na2S2O35H2O (A.R.) in 500 ml of de-ionized water to produce a 0.1 N thiosulphate solution.
Dissolve 2 g of KI in 50 ml of de-ionized water in a flask and pipette in 1 ml of hypochlorite.
Add 5–10 drops conc. HCl (12 N) and titrate immediately the liberated iodine in the solution from (ii) with 0.1 N thiosulphate solution from (i) until the yellow solution turns colourless.
The hypochlorite solution cannot be used if the titration volume of thiosulphate is less than 12 ml.
Oxidizing solution
Mix 100 ml of alkaline citrate solution (d) with 25 ml of hypochlorite (e) in a reagent bottle. This solution is unstable, and should be prepared just before analyses.
Hydrochloric acid, 10% v/v
This solution is used for washing of glassware.
Standard ammonia solution
Dissolve exactly 0.472 g of oven-dried (110°–115°C for 30 min.) ammonium sulphate (NH4)2SO4 (A.R.) in 1 litre of de-ionized water. Add 1 ml of chloroform and store it in an amber glass bottle in a refrigerator. This solution contains 100 mg N/l.
Substandard ammonia solution.
Dilute 1.0 ml of the standard ammonia solution (h) by topping up to 1000 ml in a volumetric flask with de-ionized water. The concentration of this solution is 0.1 mg NH3-N/1.
2.2 Analyses of water samples
Just before each analysis, wash all glassware with warm dil. HCl (g) and rinse very thoroughly with dist. water. The acid may be used repeatedly.
To each 10 ml sample in a test tube, add in sequence
0.5 ml of phenol-alcohol solution (b).
0.5 ml of sbcium nitroprusside solution (c).
1 ml of oxidizing solution (f)
Mix thoroughly after each addition by means of a tube buzzer.
The mouth of each test-tube should be covered with aluminium foil to prevent contamination by atmostpheric ammonia. Allow the blue indophenol to develop at room temperature for at least 60 min.
Read the absorbance of the sample solution against distilled water at 640 nm in a spectrophotometer.
For turbid samples, it is necessary to filter the sample through a filter paper first and measure the absorbance due to turbidity of the filtered sample (before addition of reagents) against distilled water at 640 nm. Then add reagents and obtain the absorbance according to steps (i)-(iv) above. The difference between the two readings is to be used in calculation in step (vii) below.
To obtain absorbance of reagent blank and substandard solution (0.1 mg NH3-N/1), treat in duplicate 10 ml each of the de-ionized water (a) and substandard solution (i) respectively with the colour-developing reagents and measure with steps (i)-(iv).
Calculate the ammonia concentration of each sample by the formulae below:-
NH3-N (mg/l) = (Ew - Eb) x f
| where | Ew = | absorbance of water sample |
| Es = | mean absorbance of substandard solution | |
| Eb = | mean absorbance of blank solution |
3. Exercise
3.1 Compare the NH3 at the surface, middle and bottom layers in the three areas surveyed. What do the data imply?
3.2 How can you make use of these data in the site identification for netcage farming? Explain.
1. Objectives
1.1 To determine analysis of chemical oxygen demand in water.
1.2 To apply the above data in site identification for netcage farming.
2. Procedure
2.1 Preparation of reagent
Sodium hydroxide solution, 10% w/v.
Dissolve 10 g of sodium hydroxide NaOH (A.R.) in distilled water and dilute it to 100 ml.
Potassium permanganate solution, 0.01 N
Dissolve 3.16 g of potassium permanganate KMnO4 (A.R.) in dist. water and dilute it to 1 litre. Store in an amber glass reagent bottle. Before use, dilute 100 ml of this stock solution to 1 litre with distilled water.
Potassium iodide
Solid granules of potassium iodide KI.
Sulphuric acid, 18 N
Add gradually 125 ml of 36 N conc. sulphuric acid H2SO4 (A.R.) to 125 ml of distilled water. After cooling, adjust the total volume to 250 ml with distilled water.
Sodium thiosulphate solution, 0.01 N
Dissolve 2.48 g of sodium thiosulphate Na2S2O3.5H2O (A.R.) and 0.1 g of sodium carbonate Na2CO3 (A.R.) in distilled water to produce 1 litre in a volumetric flask.
Starch solution
Suspend 1 g of starch powder (A.R.) in 150–200 ml distilled water. Add with vigorous stirring 6 N sodium hydroxide NaOH (24 g NaOH in 100 ml distilled water) until the solution becomes clear (about 9–10 ml). After standing for 1–2 hr, add concentrated hydrochloric acid HCl until the solution becomes slightly acidic (about 5 ml, and turns blue litmus paper red). Add 1 ml of glacial acetic acid and dilute the solution to 500 ml with distilled water. Discard this solution if the end-point colour is green or a brownish tint instead of pure blue.
Standard potassium iodate solute, 0.1 N
It is important that all standard solutions should be prepared accurately. To prepare standard iodate solution, dissolve exactly 1.784 g of oven-dried (at 105°C for 1 hr) potassium iodate KIO3 (A.R.) in distilled water and adjust it to 500 ml in a volumetric flask. Keep the resulting solution in an amber glass reagent bottle in a refrigerator. Before use, dilute 10 ml of the standard solution to 100 ml with distilled water to give a concentration of 0.01 N.
2.2 Analyses of water samples
2.2.1 Standardization of 0.01N Na2S2O3 solution
To 10 ml 0.01N KIO3 from (g), add 50 ml distilled water, few grains of KI (c) and 0.5 ml 1SN H2SO4 (d). (Add H2SO4 just before the subsequent titration).
Titrate the above solution from (i) with 0.01 N Na2S2O3 solution (e) until the yellow solution turns pale straw colour.
Then add 1 ml of starch solution (f) to solution from (ii) to turn the colour of the solution dark blue.
Proceed with the titration at moderate speed until the solution is completely colourless.
Repeat the above procedure two times more and calculate the mean volume of the three titrations.
Calculate the correction factor for thiosulphate f as follows:-
This factor should normally be close to 1.00 if the 0.01 N sodium thiosulphate solution is freshly prepared.
2.3 Titration of sample solutions
Add 1 ml NaOH solution (a) and 10 ml 0.01N KMnO4 (b) to an Erlenmeyer flask containing 50 ml of sample solution.
Heat the solution for exactly 20 min in a water bath at 80°C. After heating, cool the solution immediately in an ice box to interrupt the oxidation. The sample should now contain a light brown precipitate of alkaline metals.
The remaining permanganate in the sample solution is determined by titration. To (ii) add few grains of KI (c), and just before the subsequent titration, add 1 ml 18 N H2SO4 (d). The acid dissolves the brown precipitate and the sample solution turns yellowish brown.
Titrate the sample solution with 0.01N Na2S2O3 solution (e) as described in I(ii)-(iv).
Repeat the above procedure for blank test with 50 ml of distilled water (blank sample). The blank sample should turn greenish blue after adding KI. For blank samples, the titration volume of thiosulphate is usually within the range of 9.50–10.00 ml. This value varies with the conditions of the various reagents used and thus should be obtained in every series of measurement.
2.4 Calculations
The COD in mg/l in the sample is
| where | f = | correction factor for thiosulphate |
| b = | ml thiosulphate consumed by the blank | |
| s = | ml thiosulphate consumed by the sample | |
| v = | volume of sample (ml). |
when v is fixed at 50 ml, the above formula can simplified to
COD (mg O2/1) = 1.6f (b - s)
If the answer is in permanganate value (the consumption of potassium permanganate in mg/l) then multiply the COD obtained above by 3.95.
3 Exercise
3.1 Are there any differences in COD at the surface, middle and near bottom layers in the three surveyed areas?
3.1 Explain how you can make use of the COD data in the site identification for netcage farming.
1. Objectives
1.1 To familiarise with the use of various field equipment for site identification.
1.2 To sample water and store for laboratory analyses.
1.3 To do site measurements of water currents and other physical-chemical parameters.
1.4 To observe fouling and wave conditions.
1.5 To check type of plankton in water.
1.6 To compare data obtained for different sites surveyed and assess their suitability for floating netcage farming.
2. Procedure
2.1 Recording of data
Record the time and date of survey.
Check the tide table and calculate the tidal level at the time of survey.
Note and record the weather condition.
Record all the data collected in the data sheet.
2.2 Determination of depth
Using a sounding-line, measure the depth of survey station.
Convert the depth reading to standard depth at low water spring tide.
2.3 Water sampling
Using a Van Born water samoler, collect water samples from the surface, middle and near bottom (1m above sea floor) layers.
Measure the salinity and pH of the water samples immediately after collection and record in data sheet.
Fill water sample in 500-ml amber glass bottles for water analyses. Store the water samples in ice box for analyses of turbidity chemical oxygen demand (COD) and Ammonia-nitrogen (NH3-N) in the laboratory.
Fill water sample in plastic vial containing preservatives (acetic acid and formalin) for phytoplankton examination in the laboratory.
Label bottles and record the samples collected from each layer.
2.4 Measurement of dissolved oxygen and water temperature
Using a dissolved oxygen meter, make in situ measurement of dissolved oxygen (D.O.) and water temperature at 1-m interval from the surface to 1m above sea floor.
Record all the data in data sheet. Convert all water temperature readings from the meter to actual temperature.
2.5 Current measurement
Using a current meter, measure the speed and direction of current at 2m interval from surface to 1m above sea floor.
2.6 Plankton towing
Using a plankton net, perform plankton towing at the surface layer.
Collect plankton sample in a plastic bottle and add formalin to 5% concentration. The sample will be used for estimation of plankton biomess in the laboratory.
2.7 Observation on fouling condition and height of wave
Note the fouling conditions on the existing structures (e.g. jetty, palisade trap etc), if any, in the survey areas.
Estimate the height of wave in the survey areas.
3. Exercise
3.1 Compile all the data collected and assess the suitability of the three areas for fish farming in netcages. Base your assessment on the following considerations:-
Exposure
Current velocity
Depth
Temperature and salinity
Water quality (D.O., pH, COD, NH3-N, turbidity)
Presence of undesirable dinoflagellates
Fouling condition
3.2 What species will you culture in the area, that are found suitable for netcage farming? Give your reasons.
3.3 Among the three areas surveyed, which area is most suitable for netcage farming? Why?
Figure V/1
Current velocity at surface and near bottom in the East Johore Straits and their relation to the tidal height
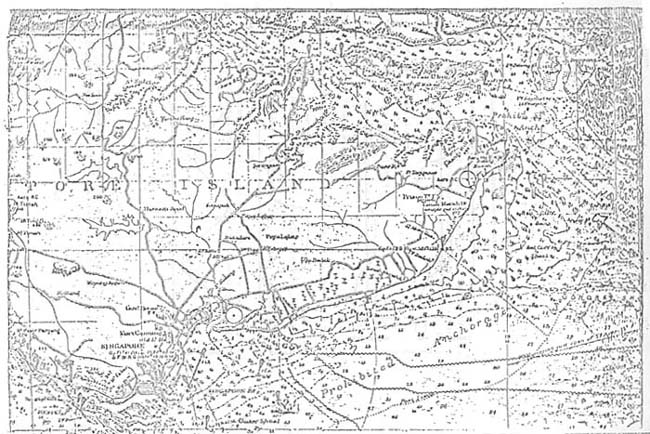
Figure V/2
Map of Eastern half of Singapore
![]()
![]()
![]()