![]()
![]()
![]()
Idealized production data, net input-output computations and net income values for both L. calcarifer and P. monodon are presented for the Malaysian model in this section. The results are indicative only serving merely as a basis for subsequent refinement of the model as noted in Section 2.1 Nevertheless, the implications of the analyses are quite important. At this stage, the model is not yet ready for a rate-of-return analysis. A new idealized farm layout would be necessary corresponding to decisions on the selection of species, size of ponds and infrastructure needed to assist artisanal families.
It must be understood that the Thai production values herein utilized are representative of high-yield system of culture achieved by only a limited number of farms in Thailand. In succeeding studies, leading to more refined versions of a Malaysian model, these values should be scale down to realistic Malaysian target production goals.
Tables 3.1 and 3.2 show the estimated annual input and output costs for P. monodon production. The data in the tables correspond to the management criteria in Appendix 3. Table 3.2 shows a net income value of only $1 386 for an operating cost of $65 814, hardly an inviting proposition. However, in the analysis the cost of seed is $0.08, or nearly five times the cost in Thailand. If the cost of seed is reduced by say, 50 percent and the price of feed is set at the current $0.10/kg at the farm, then the revised net income value is $32 586, an amount which allows for a good profit and for amortization of capital costs.
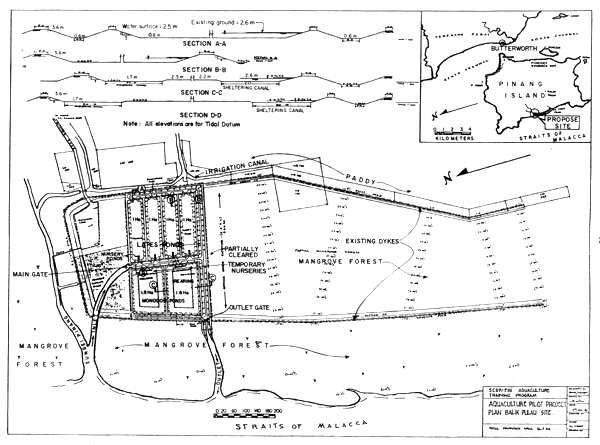
Fig. 1.3 Proposed layout of ponds at the pilot project site at Balik Pulau
| Item | Annual values | Revised values | |
|---|---|---|---|
| A. Output | |||
| No. of prawn at harvest | No. | 120 000. | 12 000. |
| Average number per kg | No./kg | 25. | 25. |
| Weight at harvest | Kg | 4 800. | 4 800. |
| Ex-farm price | $/kg | 14. | 14. |
| B. Input | |||
1. On-farm non-factor inputs | |||
a. Prawn fry | No. | 600 000. | 600 000. |
Price of fry | $/fry | .08 | .04 |
b. Pisicide | Kg | 20. | 20. |
Price of pisicide | $/kg | 7.20 | 7.20 |
c. Lime | Kg | 2 000. | 2 000. |
Price of lime | $/kg | 0.17 | 0.17 |
d. Trash fish | Kg | 48 000. | 48 000. |
Price of trash fish1 | $/kg | 0.25 | 0.10 |
2. Labour — 1 labourer | $ | 3 060. | 3 060. |
3. Equipment — nets & baskets2 | $ | 500. | 500. |
4. Operation and maintenance of pump3… 0.05 × 15 000 | $ | 750. | 750. |
5. Farm maintenance4 | $ | 1 020. | 1 020. |
| C. Other Items | |||
1. Food conversion | 10:1 | 10:1 | |
2. Survival rate (%) | 20. | 20. | |
Footnotes:
1 $0.25/kg is import cost. Local farm costs are only $0.10/kg.
2 Equipment, the replacement of the nets and baskets takes place every
year.
3 Operation and maintenance of pump is assumed to be 5% of the capital
cost of pump = 0.05 × 15 000 = $750.
4 Maintenance of pond, prorated at 3% year of total costs 0.03×(49 000
— $15 000) = $1 020.
| Item | Annual values | Revised values1 |
|---|---|---|
| A. Gross output value | $ 67 200 | $ 67 200 |
| B. Input values | ||
1. On-farm non-factor input | ||
a. Fry | 48 000 | 24 000 |
b. Pisicide | 144 | 144 |
c. Lime | 340 | 340 |
d. Trash fish | 12 000 | 4 800 |
2. Labour | 3 060 | 3 060 |
3. Equipment — basket & nets | 500 | 500 |
4. Operation of pump | 750 | 750 |
5. Farm maintenance | 1 020 | 1 020 |
| Total input value | 65 814 | 34 614 |
| C. Net income | 1 386 | 32 586 |
1 Based on seed price of $M 0.04 per piece.
First and foremost, the profit of P. monodon pond culture is most sensitive to fry costs. Even reducing the fry costs by 50 percent to $0.04, helps to achieve a substantial profit. With Thai costs at only $0.016, some further reduction should be possible and serves as a target.
The profit was also increased by using a possible direct cost of the farm of $0.10/kg for trash fish, instead of the present import cost of $0.25/kg. It can be argued that if the import cost is used for trash fish, then the export price of the gross output also should be used. The above changes in costs of fry and trash fish make the pond culture of P. monodon highly attrative.
Although the culture of P. monodon would require the import of trash fish, the bulk of the output could form a higher value export item, so the net effect on the national balance-of-payments would be favourable. Utilization of prepared feeds based on ingredients produced in Malaysia could further reduce the import requirements for trash fish.
Tables 3.3 and 3.4 show the annual production and residual value data for the culture of this species based on the management criteria in Appendix 4. The net income value of $79 068 for an input of $70 932 is quite acceptable.
| Item | Annual values ($ M) | |
|---|---|---|
| A. Output | ||
| Number at harvest | No. | 25 000. |
| Average number per kg | No./kg | 1. |
| Weight at harvest | Kg | 25 000. |
| Ex-farm price | $/kg | 6. |
| B. Input | ||
1. On-farm non-factor inputs | ||
a. Fish fry | No. | 50 000. |
Price of fry | $/fry | .40 |
b. Pisicide | Kg | 10. |
Price of Pisicide | $/kg | 7.20 |
c. Lime | Kg | 2 000. |
Price of lime | $/kg | 0.17 |
d. Trash fish | Kg | 175 000. |
Price of trash fish1 | $/kg | 0.25 |
2. Labour — 1 labourer | $ | 3 060. |
3. Equipment — baskets & nets2 | $ | 500. |
4. Operation of pump3 | $ | 750. |
5. Farm maintenance4 | $ | 2 460. |
| C. Other items | ||
1. Food conversion | 7:1 | |
2. Survival rate | 50% | |
| Footnotes: | ||
1 Price of trash fish is import cost, at-the-farm cost is $0.10/kg.
2 Equipment is assumed to last for 4 years only.
3 Maintenance and operation of pump is assumed to be 5% of the capital
cost of pump = 0.5 × 15 000 = 750.
4 Maintenance of ponds = 0.03 × ($97 000 - $15 000) = $2 460.
| Item | Annual values ($ M) |
|---|---|
| A. Gross output value | $ 150 000 |
| B. Input value ($) | |
1. On-farm non-factor input | |
a. Fry | 20 000 |
b. Pisicide | 72 |
c. Lime | 340 |
d. Trash fish | 43 750 |
2. Labour | 3 060 |
3. Equipment — baskets & nets | 500 |
4. Operation of pump | 750 |
5. Farm maintenance | 2 460 |
| Total input value | 70 932 |
| C. Net income | 79 068 |
The most striking aspect of the production data is the amount and cost of trash fish required. Because Malaysia is already a net importer of trash fish (32 413 tons in 1979), the net input requirements for, say, 1 000 ha of pond culture would be at a staggering quantity of 175 000 tons. The corresponding net loss in balance of payments would be 175 000 × $250 = $43 7500 0001. The balance of payment factor is particulary significant in view of the fact that the seabass produced would be primarily for domestic consumption.
The culture of the seabass in Thailand is a longstanding, profitable operation. However, Thailand is a net exporter of trash fish and therefore, the economic setting is quite different.
In addition, the culture of L. calcarifer in ponds at an estimated cost of $97 000/ha is very capital-intensive as compared to cage culture, primarily because the excavation cost of providing the required water depth for culture of the species.
![]()
![]()
![]()