![]()
![]()
![]()
The following 11 variables were identified as important by TOPC (section 2.4) and confirmed by the meeting participants. Each variable was then analysed to ascertain the present status of the observations and data products, their adequacy, and key actions required improving the status of these observations.
6.1 Surface Water-Discharge
1. Available data
1a. Point data
Discharge is typically calculated at a particular location in a river from measured water levels (the 'stage' or water level) by means of a transformation or rating curves developed for the particular channel cross-section at which the stage is measured. At many stations the water level is measured automatically in time-steps of several minutes to one hour. Because of the dynamics of the river bed, this rating curve has to be recalibrated with appropriate frequency. Other factors can also influence the transformation stage à discharge, including the presence of ice or vegetation or debris in the channel. Flow in a channel can be influenced by factors such as changes in land use, withdrawal for water use, or contributions from artificial water storage reservoirs, and thus discharge does not necessarily represent a response to climatic conditions.
The primary sources for hydrological data and information are the national Hydrological Services (NHS). These data are subsequently made available to other programs. For example, GRDC is the primary source for historical time series containing daily and monthly discharge data globally. WHYCOS and FRIEND potentially have global scope but are implemented through regional projects. GRDC has recently made substantial progress in compiling information on hydrological real-time data available on the Internet. Data collected from the Internet could be a component of a global hydrological network, and WMO therefore intends to request Member countries to provide information on stations that operate now and report in real-time. After obtaining this information a list of stations will be compiled in co-operation with GRDC which WMO will explicitly request the Member countries to include in a global hydrological network. Examples of stage height and/or discharge measurements now available via the Internet include the US Geological Survey (http://water.usgs.gov/), Water Resources Research Centre in Hungary (http://www.vituki.hu), and hydrometeorological services of South America, Central America and the Caribbean whose data are available via a pilot web-based system R-Hydronet (http://www.r-hydronet.sr.unh.edu). This system was developed by the University of New Hampshire with the support of UNESCO Regional Office for Science and Technology ROSTLAC in Montevideo, Uruguay and provides access at three levels (anyone, participating services, and data owners).
1b. Gridded data
Observed river discharge represents the aggregated signal of the spatially variable runoff which is generated on the land surface as a surplus of precipitation. The excess water leaves land mass horizontally via various transport mechanism (surface sheet flow, groundwater flow, or river flow). Observed river discharge is the aggregated signal of this surplus water measured at some specific location along the river.
Since runoff cannot be measured directly over large areas, discharge at a river station is employed as the related measured variable. In contrast to most of the hydra-meteorological variables measured at a point, discharge has an area-integrating character. However, its regionalisation (i.e., determination of the spatial distribution of runoff) brings along some specific problems. The traditional approach employs water balance model calculation that considers precipitation and evapotranspiration computed from other measured climate variables (air temperature, vapour pressure, solar radiation). A better approach is to apportion the observed river discharge over the contributing landmass (Fekete et al., 1999). Since river discharge is typically measured at 10-20 percent accuracy (Dingman, 1994) as one of the most accurately measured component of the hydrological cycle (Grabs et al., 1996; Hagemann and Dumenil, 1998), runoff estimates derived in this manner should have higher accuracy.
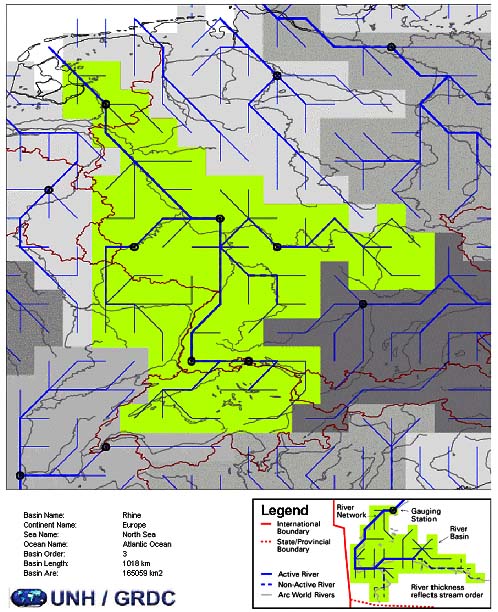
The pre-condition to obtaining gridded runoff fields from discharge is an acceptable relation between the river stations, its discharge data, and the grid cells. This relation may be established from a digital elevation model (DEM), converted into an elevation grid and used to calculate the flow direction for each grid cell so that an artificial river net is produced. In addition, a net of basin boundaries can be created from the elevation grid. The main difficulty is that DEM will not capture all topographic features that should be considered in modelling the natural flow. Most problems will be found in very flat areas and in locations where the natural rivers cross mountains through narrow canyons. Since these cases can produce dramatic errors in the artificial river net the DEM must be manually edited by creating virtual walls or canyons to initiate flow directions resembling the natural flow. - Another problem is connected with the precise location of the river stations. Because of the differences between the artificial and the natural river nets one must manually establish the relation between the existing stations and the artificial river (Figure 2). Currently, different methods are under development for reducing the errors mentioned above and to make the procedures more automated.
After the artificial river net is linked with the discharge measurement stations, it is possible to estimate runoff for individual grid cells. Most of the available models use monthly means of discharge or long-term averages of monthly means. If the time step is reduced to daily or hourly, new types of models will be needed which better account for the storage capacity properties of the rivers and basins.
At present, only few gridded runoff products with a global coverage are available and all consider only long term means of variables. One of the most detailed global DEM is the USGS' 30 arc-second digital elevation model of the world. Under the name HYDRO1k it includes the gridded flow directions and river net. However, while this gridded network is the best available one at high resolution, it still suffers from errors since detailed manual corrections were limited by the enormous amount of data processed. At the present time GRDC is investigating these data sets for different potential applications.
A simple algorithm developed recently (Fekete et al., 2000) offers rescaling high resolution gridded networks (such as HYDRO1k) to any coarser resolution. Applying coarser resolution networks for large scale studies has two advantages. First, the gridded network is more manageable for correction and manipulations. Second, the coarser resolution requires less computation in horizontal water transport schemes. Thus, a 5-10 km resolution of gridded networks is probably appropriate for flow simulation at daily time steps, and 0.5o x 0.5o networks should satisfy the need of monthly flow simulations.
Figure 2. Topology for Gridded Discharge Products
Example from: The UNH, GRDC Global Composite Runoff Data Set (v1.0) on CD, 2000
2. Does it meet requirements?
At the present time there is almost no international exchange of near real-time (NRT) or real-time (RT) discharge data. Only in few areas, regulated by international agreements and river commissions, NRT data exchange is taking place. In recent years, increasingly more national hydrological services present NRT data from their main river stations on the Internet (see above), so far mostly as stage level with a daily time step.
For climate and weather prediction purposes gridded runoff fields are necessary in NRT mode (section 4). This requires an access to suitable discharge data from selected hydrological stations world-wide. Furthermore, it requires an operational gridded runoff field-generating product.
Runoff is measured more reliably than precipitation and evaporation, and since the difference between precipitation and evaporation shows stronger temporal variation, trend analysis is easier to perform. However, trends are often not so much caused by climatological variations as by local impacts on the hydrological regime (such as local water extraction and consumptive use). Therefore, separation of local factors and regional or global change is difficult without the additional information on water use (section 4.3, 4.4).
3. Key actions
The extent of Internet - accessible discharge and water-level data should be determined. Priority attention should be given to the 200 stations used by GRDC in the calculation of the freshwater fluxes into the ocean (Grabs et al., 1996). This subset should be gradually extended, and the final list of stations should be identified after also considering results of network design studies (see Fekete and Vörösmarty, Appendix 3).
As a starting point for a global hydrological network, data should be obtained from the 200 gauging stations close to the mouth of rivers. These data should be available in a timely manner, where possible in near real-time mode wherever possible. In relation to the GEWEX CSEs and particularly efforts to compile global data sets in an Co-ordinated Enhanced Observation Period (CEOP) between 2002 and 2005, liaison should be established to take advantage of these data collection efforts and to promote the role of the global hydrological network in the GEWEX Hydrometeorological Panel (GHP).
WHYCOS and FRIEND regions might contribute to a global hydrological network as regional centres for collecting real-time data. This could be done via a Web interface with upload and download capabilities (section 7).
Concerning observation needs, it was concluded that stage heights with corresponding rating curves should be reported, in addition to discharge. Rating curves are important as metadata for the gauging stations, however their time-varying nature must be taken into consideration. It was recognised that the conversion of gauge heights into discharge outside the control of the institution responsible for the collection of data might result in serious quality assurance questions.
The usefulness of existing gridded runoff field products for quasi-operational use should be tested. These products could also be used easily as an additional input for climate forecast models (validation and calibration). They could be presented on the Internet using tools such as similar to the GPCC-visualizer (http://www.dwd.de/research/gpcc/visu_gpcc.html).
An ongoing review of new developments in hydrometry should be maintained (e.g., the proposed HYDRA-SAT; Vörösmarty et al., 1999;http://lshp.gsfc.nasa.gov/Post2002/hydrasat/hydrasat2.html).
4. Historical data
At the global scale GRDC collects and archives daily and monthly discharge data from approximately 3800 selected stations with a more-or-less regular updating by NHSs. Most NHSs store all of their discharge and water-level data at country level in different non-standard formats.
6.2 Surface Water Storage Fluxes
This variable is directly related to the retention of surface fluxes in lakes, reservoirs and wetlands. The participants also discussed the issue of water storage in river channels, flood plains and large estuaries but decided to exclude these types of storage for the initial period.
At present, most climate circulation models do not realistically model lateral water fluxes, in part because of inadequate information on flow times; flow retention in dams, reservoirs, lakes and wetlands; and the evaporative loss of water from storage surfaces. Improved data are therefore required to increase the realism of the model results.
1. Available data
At the present, coherent lake reservoir data bases with global coverage do not exist, however pieces are available at various locations. The International Lake Environment Committee (ILEC, a non-governmental organisation established in 1986 in Japan, http://www.ilec.or.ip/e_ index.html) maintains a database of lakes and reservoirs, however this database does not contain time-series of relevant hydrological variables. Another lake database, the MSSL/WCMC/UN Global Lake and Catchment Conservation Database', was developed by Mullard Space Science Laboratory of the University College London as a prototype for remote sensing applications (Birkett and Mason, 1995). It includes over 1400 lakes and reservoirs, but a very limited set of attributes (lake names, location, country, surface area and elevation estimated from Operational Navigational Charts maps, etc.; http://wwwcpg.mssl.ucl.ac.uk/orgs/un/glaccd/html/mgld.html). Remote sensing (satellite altimetry, and monitoring of the area of lakes and reservoirs) has the potential to provide some of these attributes (Birkett and Mason, 1995).
The International Commission on Large Dams (ICOLD) maintains a registry of dams (ICOLD, 1988). This database was originally published in books (paper form only), but recently became available electronically on CD-ROM. The ICOLD registry contains information on several thousand reservoirs, assembled from an engineering perspective. One criterion for including reservoirs in this registry was to have 15 m or higher construction, thus potentially leaving out many reservoirs in plain regions where several metres high dam construction might result in large inundation. While detailed information on the dam construction (purpose, height, length and volume of the construction, construction type, spillway capacity,) are provided beside basic information on the reservoir itself (maximum capacity, reservoir surface area, etc.), but other essential information (including location, mean discharge through the reservoir) is missing. The only way to geographically identify these reservoirs is by the nearest city and river names that are provided as part of the database. Several attempts have been made to identify these dams on maps and correct the information (by UNH, GRDC, CESR). - In related efforts, USGS developed a dam inventory for the US, and Russia maintains a database of lakes and reservoirs of the national territory.
The merging of the above mentioned lake and reservoir data sets with the available digital maps could be a basis for a more detailed global lake/reservoir database, but this work is not trivial and needs extensive manual effort.
It was noted that at present no dynamic information is available on lakes and reservoirs (level changes, operation, etc.). Remote sensing (satellite altimetry, monitoring of the surface area) has the potential to solve this problem. The group was informed that NASA GSFC is working on using satellite altimetry (TOPEX/POSEIDON, ERS-1) to measure lake and reservoir levels (Birkett, 1998).
2. Does it meet requirements?
No. At the present time, global information on surface water storage in lakes, reservoirs and wetlands is inadequate in terms of coverage and time-series observation of changes in the storage volume at all scales. However, it was noted that higher resolution information available only in some regions is also important, given the regional nature of some hydrological issues.
3. Key actions
The State Hydrological Institute (SHI), St. Petersburg, Russia expressed an interest in hosting a global data centre for lakes and reservoirs. WMO intends to follow up on these activities. Furthermore, contacts should be made with ILEC to determine a possible inclusion of its database.
6.3 Groundwater Fluxes
Groundwater fluxes have a major influence on the dynamics of the global hydrological cycle (Zekster and Loaiciga, 1993). Because groundwater tends to respond more slowly to short term climatic variations than do surface water resources, this variable is often not considered to be of first-order importance from climate change perspective. A US National Research Council panel (Panel on Climate Observing Systems Status, 1999) considered groundwater data to be of low importance for the detection of groundwater change, but highly important to climate questions because of its high potential impact. Alley et al. (1999) also noted that climate can be a key consideration in the sustainability of ground water resources.
1. Available data
The group recognised that, similarly as for surface water storage fluxes, no global ground water flux data sets are readily available at the present. Some attempts have been made to organise national collections of time series data, notably by the Netherlands, the UK and the US, and some regional data sets are accessible via Internet.
2. Does it meet requirements?
No.
3. Key actions
An International Groundwater Resource Assessment Center (IGRAC) has been proposed by the Government of the Netherlands to the WMO Commission on Hydrology. If accepted at the November 2000 meetings in Nigeria, this center will close an important information gap. It is expected that variables to be documented by IGRAC would include: groundwater levels in boreholes, water volume changes, aquifer characteristics such as porosity and transmissivity, aquifer withdrawal rates, recharge rates, and well productivity.
6.4 Biogeochemical Transport from Land to Ocean
These measurements are intended to quantify the transport of carbon, phosphorus and other elements from the terrestrial environment to oceans.
1. Available data
At present no comprehensive global monitoring programme is in place. However, GEMS/Water obtains data from numerous water quality observing stations (refer to section 5.3 and Appendix 3), although the water quality information is not available near real-time. The Centre releases data products and assessment results, while the distribution of raw data is governed by agreements with data providers. All data in the GEMS/Water Global Database are available for use in global and regional assessments undertaken by the UNEP GEMS/Water Collaborating Centre (GWCC) and may be used in other assessment programs where the GWCC is participating.
GEMS/Water produces publications guiding the design and operations of freshwater monitoring programmes at the national and multi-national levels. The GEMS/Water Operations Guide is available in five languages and is provided at no charge to participating countries. The guide includes sections on site selection, sampling procedures, data handling, and database operations. This information is a valuable tool in establishing BGC transport data requirements, particularly in developing countries. Similarly, GEMS/Water produces information on quality control design and data integrity along with an analytical methods manual and methods dictionary.
Recent assessment reports include Persistent Organic Pollutants in the Asia/Pacific Rim, and Persistent Organic Pollutants in the Russian Federation. A detailed listing of GEMS/Water products is available on the GEMS/Water web site <http://www.cciw.ca/gems>.
Other programmes and activities relevant to BGC fluxes from land to oceans include the IGBP project Land Ocean Interaction in the Coastal Zone (LOICZ), the multi-agency programme Land Based Sources of Pollution, and the UNEP Global Programme of Action.
2. Does it meet requirements?
The requirements for comprehensive information on BGC transport from land to oceans cannot be fully met by the existing observation sites. However, the data are sufficient to provide the preliminary input to this component, and funding as well as other support will be required for expanded operations.
3. Key actions
A list of water quality variables needs to be developed through consultation with scientific and other users; carbon, nitrogen and other nutrients should be considered (GCOS, 1997). The serious impact of micro-pollutants (such as chemicals in the POP family) on the environment was recognised. However, the scarcity of qualified analysing laboratories would pose a severe constraint on operational monitoring systems. The GEMS/Water Analytical Methods Dictionary will be made available to collaborating organisations to assist in improving BGC transport observations.
Data collection activities should be intensified. Co-ordination of data acquisition is needed to ensure that an appropriate data mesh can be achieved, particularly for the computation of fluxes.
Contacts should be made through GEMS/Water with other groups collecting or using biogeochemical data (LOICZ, UNEP, etc.) to investigate areas of possible co-operation.
6.5 Isotopic Signatures
1. Available data
About 180 precipitation stations presently collect samples for monthly isotopic analysis by GNIP. More frequent measurements are undertaken for a few research stations over shorter periods. The GNIP database is available for public use <http://www.iaea.org/programs/ri/gnip/gnipinfo.htm> and presently contains data until 1998. Each year an update is released, with the time delay of about two years being unavoidable due to the complicated laboratory analysis procedures and data reporting to IAEA. The GNIP database will soon be merged in the more comprehensive data system ISOHIS (Isotope Hydrology Information System), which will include data from IAEA technical co-operation projects on water resources assessment and management (local/regional field studies on surface and ground water of typically two years' duration).
The operational use of isotope measurement in riverine environment was extensively discussed at the meeting. While the monitoring programme has research flavour at the present time, the physical processes are well known and the isotope measurements could be used immediately for water balance studies using e.g. water stable isotopes (Kendall, 1997).
In addition to the GNIP data base, several modelling groups have published gridded global data sets on the stable isotopic composition of precipitation and air moisture.
2. Does it meet requirements?
No, in terms of a NRT network, which is not feasible for any parameter to be measured in laboratories. Yes, in terms of scientific communities requesting such isotopic information for studies of climate change, paleoclimate and hydrological investigations.
3. Key actions
It is suggested that as an initial step, up to 30 stations in representative river basins be identified, perhaps with special focus on the GEWEX and WHYCOS regions and possibly also FRIEND and HELP basins. The participants recommended that a mechanism should be developed to promote isotope measurements; WMO and UNESCO may also assist in this regard. The most useful isotopes have already been identified: d18O, d2H, and 3H. The group further recommended placing emphasis on flux stations with very good data series and on stations with high observation frequency. GEMS/Water will inquire about the extent of isotope analysis through the GEMS/Water network and will consider the application of water sampling for further isotope analysis undertaken by IAEA programmes (GNIP). In 2001/2002, IAEA will launch an international co-ordinated research programme to investigate in detail the feasibility and pre-conditions necessary for a river basin isotope sampling network.
4. Historical data
Virtually all existing historical data are incorporated in GNIP.
6.6 Water Use
1. Available data
1a. Polygon data
Internationally, water use data are highly heterogeneous in quality and availability (administrative, spatial and temporal). The most recent historical and present-day estimates of withdrawal and consumptive water use are provided by Shiklomanov (1999) who provides information for 26 natural-economic regions covering the whole globe as well as for selected countries. The World Resources Institute (1998) provides a compilation of sectoral water withdrawals by country. The only consistent data set for water use, with a high spatial resolution (county level) is available for the United States in the 5-year reports of the USGS (USGS, 1998).
1b. Gridded data
At the University of Kassel, the WaterGAP 2 model is used to derive sectoral water uses for the year 1995 with a resolution of 0.5o x 0.5o. Model results are based on published data on irrigated areas, livestock numbers, and country values of domestic and industrial water use. Due to the high uncertainty of the input data, the gridded water use data are also uncertain.
2. Does it meet requirements?
No.
3. Key actions
Appropriate national bodies should be encouraged to develop a reporting model of spatially resolved sectoral water use. The USGS scheme (reporting by both political and hydrologic spatial units, for various economic/industrial sectors, on a five-year time step) could be used as an appropriate model format. Furthermore, countries should make the information on water use internationally available. The participants were also informed that water quality indicators would be proposed as part of the World Water Development Report, to be published in early 2002.
6.7 Precipitation
1. Available data
1a. Point data
Precipitation is observed at a large number of stations (about 200,000 world-wide) in national meteorological or hydrological networks. Most of the data are used mainly in a national framework.
Various meteorological variables including precipitation depth and type are routinely observed on an hourly to daily basis at synoptic weather stations. The data are transmitted in RT or NRT as SYNOP to the national meteorological services. A subset of the records (nominally from 8,000 stations) is exchanged globally among the national meteorological services using the World Weather Watch Global Telecommunication System (GTS). Within this system, precipitation data are presently available from about 4,000 stations. Additional synoptic data are exchanged regionally (RBSN = Regional Baseline Synoptic Network) or through bilateral agreements.
Daily climatic data of precipitation and air temperature are also observed by large networks. Monthly-summarised observations are also globally exchanged as CLIMAT via GTS from nominally 2,200 but actually ~1,200 stations. The CLIMAT and SYNOP collections are partly overlapping. Users can obtain the global, regional or national synoptic or climate data from the national meteorological services on request.
About 1,000 stations, globally distributed and providing historical time-series and still being operated, are defined in the GCOS Surface Network (GSN). Monitoring centres supervise the data availability. These stations are partly overlapping the CLIMAT collective.
Additional precipitation data are collected in delayed time by individual institutes based on special bilateral or international agreements. The use and distribution of these data is generally restricted to defined projects.
1b. Gridded data
The access to gridded data is generally less restricted than to point data. There are several sources of global or regional gridded precipitation data:
Derived from raingauge data (GPCC, CRU)
Based on satellite observations (NOAA, NASA)
Combined from raingauge and satellite data (GPCP, NCEP)
Produced from NWP model data assimilation or forecasts (ECMWF, national meteorological services)
Radar-based (quantitative data only for few regions or countries available, e.g. Japan, USA)
Special regional combined or single-source analyses (e.g. GEWEX CSEs).
Gridded data should provide accuracy measures or information on the error with the precipitation on the grid.
2. Does it meet requirements?
The observational database of global gridded precipitation data sets is not yet sufficient in terms of the number of stations and the timeliness of data availability. Even for a relatively coarse product (global monthly product with a spatial resolution of 1.0° x 1.0°) data from 40,000 raingauge stations world-wide should be available on a routine basis and in timely fashion.
3. Key actions
Regulation of the global exchange of additional precipitation data. Renew emphasis should be placed on the recommendations of 10th WMO Congress 1987 to increase the dissemination of precipitation CLIMAT reports globally from 2,200 stations as nominal now to 25,000 stations (WMO Technical Regulations (B.1.) 3.1.1.2).
Evaluation of other data transmission systems if GTS is unable to support larger data amounts.
Supporting the initiative of an international Global Precipitation Mission (GPM) as a global follow-up to the Tropical Rainfall Mapping Mission (TRMM).
4. Historical data
The Global Historical Climatology Network project of NCDC in Asheville, US collects available historical precipitation and air temperature data. The data set is freely available at WDC-A for research purposes. The temporal and spatial coverage of this collection is very heterogeneous and contains numerous gaps. An additional quality control and supervision of the entire data set would be very valuable.
Gridded precipitation data derived from raingauges are available for the entire 20th century from CRU. However, the temporal and spatial coverage of the data used in the analysis is very heterogeneous and partly incomplete. CRU and GPCC are working to improve and homogenise the database.
6.8 Evapotranspiration
This section only considers 'direct' measurements of actual ET, not potential evapotranspiration (PET) estimates from formulae or from pan evaporimeters. Strictly speaking, even the direct measurements are estimates because of the observation methods used.
1. Available data
1a. Point data
Traditional assessments of ET have been made using lysimeters. Recent developments using flux towers enable estimates to be made using eddy correlation and Bowen Ratio techniques. There are relatively few of the towers and the longest time series are ~5 - 10 years. Estimates using both methods are not exchanged internationally and are rarely available in real time, even nationally. There are intentions, however, to make some estimates (e.g., from the ARM/CART sites in Oklahoma, USA) available in near-real time to evaluate the performance of reanalysis and operational analyses.
1b. Gridded data
There are as yet no gridded ET products, except possibly in climatological (long-term averages) atlases.
2. Does it meet requirements?
At present data availability preclude the use of ET estimates for model validation in operational analyses. ET is used in few climate variability and change studies, partly because of availability but principally because long time series do not exist. ET is a component of the water balance and is thus important for hydrological and ecosystem modelling. In many studies, use is generally made of PET calculated from formulae.
3. Key actions
A pilot project is needed to test whether estimates from the few FLUXNET sites can be made available in near-real time. The project should also consider methods for evaluating the performance of operational analyses and whether the raw measurements can be directly assimilated by operational analyses, potentially improving global scale prediction on time scales of 2 days and longer.
4. Historical data
(a) FLUXNET
FLUXNET data area available for one to <10 years for a variety of terrestrial sites. An Internet site has been set up to facilitate the acquisition and exchange of these observations (http://www-eosdis.ornl.gov/FLUXNET/).
(b) Lysimeter
These data are likely to be archived locally, principally by the agroclimatological centres that collected the data.
6.9 Vapour Pressure
It was decided at the meeting to substitute vapour pressure for the originally defined relative humidity. An important reason is that vapour pressure is reported on GTS, is directly useful for NWP modelling and, given air temperature, can be used to compute relative humidity (New et al., 1999, 2000).
1. Available data
1a. Point data
The components needed to calculate vapour pressure are measured at the vast majority of GTS stations on the SYNOP and CLIMAT networks. All the issues, therefore, that relate to precipitation apply for this variable. In addition, new data sources are emerging (e.g., sensors installed on aircraft platforms) that are likely to increase in importance in the future.
1b. Gridded data
Fields are available for the surface in the reanalyses (e.g., by NCEP) and in all operational analyses.
2. Does it meet requirements?
As with precipitation, more station data from the RBSN/RCIN could be exchanged, improving the density of point measurements in some WMO regions and the quality of reanalysis/NWP data sets.
Vapour pressure is rarely used in climate variability and change assessments, although it is an important component of many potential evapotranspiration formulas and consequently is a factor in many water cycle and sustainable development studies. On monthly time scales, however, it has correlation decay lengths comparable to temperature (New et al., 1999, 2000), so a network as dense as for precipitation is not required.
3. Key Actions
Improve the density of measurements, and facilitate international exchange by making RBSN/RBCN data available to all regions (as for precipitation measurements).
4. Historical data
Monthly values, part of CLIMAT messages, have been archived at a number of centres (e.g. WDC-A, NCDC/NCAR) since vapour pressure was added to the CLIMAT network in 1961.
Gridded fields of vapour pressure at a 0.5° x 0.5° resolution are available from the Climatic Research Unit (CRU, UEA) for the period starting in 1901 (New et al., 1999, 2000). These fields use measurements from the CLIMAT network after 1961 and empirically derived relationships before this date (using cloudiness and diurnal temperature range). Fields before 1961 are less reliable because they are based on these empirical relationships and the data for the primary valuables are less spatially complete.
6.10 Soil Moisture
1. Available data
1a. Point data
A number of networks for soil moisture measurements exist in different parts of the globe. However, at this time there are no co-ordinated international networks for such measurements on a regular basis. The Illinois, US network includes soil moisture measurements at 19 stations from 1981 to the present and represents one example of data source suitable for some climatological studies.
Recent advances in the technology of soil moisture measurement have made it feasible to establish sites for automated soil moisture and soil temperature profile measurements. The US Department of Agriculture is implementing a Soil Climate Analysis Network (SCAN) for the USA and currently has more than 40 stations reporting in real time. A multi-scale network of heat dissipation sensors was also installed in 1996 within the Oklahoma-Kansas region. This network consists of 132 stations, recording observations as often as every 30 minutes. Several of the GEWEX CSEs (including GAME, GCIP and the LBA) have supported the installation of automated soil moisture sensors as part of their research activities.
1b. Gridded data
There are no gridded soil moisture data sets currently produced from point measurements. The global modelling and prediction centres that currently operate coupled land surface-hydrology/atmosphere models for analysis and predictions are capable of producing gridded soil moisture data as an output from these coupled models; however, these outputs are highly model- dependent.
A research project supported by GCIP is now producing experimental gridded soil moisture data using a Land Data Assimilation System (LDAS) which covers the conterminous US (Mitchell et al., 1999). LDAS could be implemented as part of the operations by NCEP if the current experiment achieves improving weather predictions from the regional NWP model. In another project, a soil moisture index for Europe and Africa is derived from meteorological satellite data; this work is done within the framework of the EUMETSAT Satellite Application Facility for Land Surface Analysis (Land-SAF) and is led in Germany by the Federal Institute of Hydrology.
2. Does it meet requirements?
The requirement for soil moisture data for weather and climate prediction is not being met except as derived within the prediction model. For sustainable development it may be necessary to use separate models tuned to hydrology and carbon with the goal of developing an integrated land/biosphere model.
3. Key Actions
Encourage further development of the model-based regional soil moisture products and their extension to a global scope and ongoing operation
Support the installation of point measurements at appropriate meteorological stations, especially those designated as part of the regional and global synoptic networks of WMO
Support further assembly of historical soil moisture data sets for climate variability and change assessment. This should include the compilation of available point measurements and the preparation of retrospective LDAS model-based soil moisture products
Support development of satellite missions capable of delivering soil moisture information such as the currently planned Soil Moisture Ocean Salinity (SMOS) mission by the European Space Agency.
4. Historical data
In situ measurements of soil moisture have been made by a number of countries around the globe during the past 70 years. Robock et al. (2000) describe a global soil moisture data bank dedicated to collection, dissemination and analysis of soil moisture data from around the globe. The data bank, as of late 1999, had soil moisture observations from over 600 stations from a large variety of global climates, including the former Soviet Union, China, Mongolia, India and the US. Most of the data are in situ gravimetric measurements of soil moisture; all extend for at least six years and most for >15 years. Most of the stations have grass vegetation, and some are agricultural sites.
The lack of routine observations of soil moisture has led to the use of surrogate measurements and modelled estimates as substitutes, thus limiting the possibility of verification and intercomparisons among 'non-standard" estimates of this variable. One of these is referred to as "soil wetness" which refers to the amount of soil water computed from a land-surface model. The Global Soil Wetness Project (GSWP) is an ongoing modelling activity of the International Satellite Land Surface Climatology Project (ISLSCP). One of the goals of the GSWP is to produce state-of-the-art global data sets of soil moisture, surface fluxes, and related hydrologic quantities. A Pilot Phase of the GSWP made use of the ISLSCP Initiative I data to produce a two-year global data set of soil moisture, temperature, runoff, and surface fluxes by integrating one-way uncoupled land-surface parameterisation (using externally specified surface forcing and standardised soil and vegetation distributions; Dirmeyer et al., 1999).
6.11 Snow Depth and Snow Water Equivalent
1. Available data
1a. Point data
Snow depth is reported in the WMO synoptic code. Snow water equivalent data are largely based on snow surveys conducted by countries at higher latitudes.
1b. Gridded data
Daily operational products of areal extent of snow cover in the Northern Hemisphere are generated by the NOAA National Environmental Satellite Data and Information Service (NESDIS). Regionally, operational snow water equivalent products are prepared daily for the western portion of the USA by the NOAA/National Operational Hydrology Remote Sensing Center using ground based and airborne survey data as well as satellite data. Products for the eastern USA are made as needed based on snow cover analysis.
2. Does it meet requirements?
The areal extent of snow cover for the Northern Hemisphere is adequate for the current applications in regional and global prediction models. The currently available snow water equivalent data are too limited in geographic coverage for weather and climate forecasting purposes.
3. Key actions
Evaluate the feasibility of producing modelled snow water equivalent products using energy balance principles and mesoscale atmospheric model output.
Support the further development of deriving snow water equivalent and snow cover from satellite data
Endorse the plans of the Climate in the Cryosphere (CLIC) subprogram in the WCRP to collect global cryospheric data including snow water equivalent.
4. Historical data
Gridded products of areal snow cover exist since the advent of the operational polar orbiting meteorological satellites in the late 1960's with evolutionary improvements in quality resulting from improvement in the sensors and the analysis techniques. Synoptic observations of snow depth exist as part of the global archive for this data set. The WDC-A maintains various holdings of data on climate, glaciers, ice cores, ice sheets, lake and river ice, snow, permafrost and frozen ground <http://nsidc.org/NSIDC/CATALOG/index.html>.
6.12 Integration of Hydrological Information in a Geographical Information System
The assembly of hydrological data sets is the first step in applying these in hydrological analysis, but due to the spatial nature of hydrological processes it is essential that they be organised in a coherent way. The incorporation of gridded data into a geographic information system (GIS) context must give special attention to the co-registration of point data (discharge gauging stations or the location of reservoirs, water uptake, pollution sources, etc.) to gridded river networks. One advantage of linking different data sets within GIS is the ability to identify inconsistencies in the different data layers, e.g. catchment area reported at discharge gauging stations vs. the catchment area estimated from a simulated gridded river network; identification of the adjacent downstream gauging station; calculation of inter-station areas and inter-station discharge; co-registration of reservoirs, gridded river network and runoff fields; residency time (reservoir capacity / discharge); and others.
![]()
![]()
![]()