Previous PageTable Of ContentsNext Page

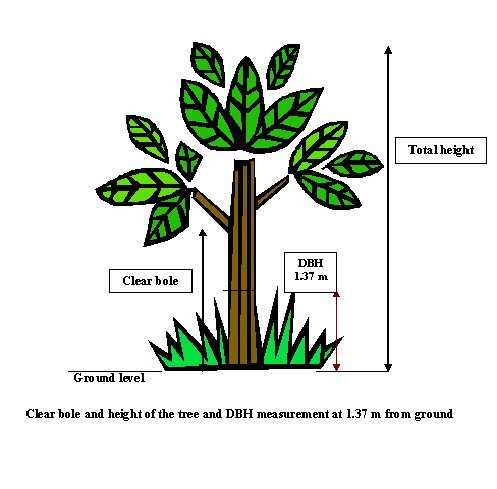
CHAPTER IV: Volume tables and equations

The main objective of a TOF inventory is to estimate the growing stock, which is essential for sound management, planning and policy formulation. For management purposes, the user is often concerned with determining the volume of a large number of trees of distinct dimensions. To do this requires volume tables. Volume tables are based on diameter and/or height and/or tree form. They are often derived via volume equations that are statistically sound and based of regression analysis.

Volume tables

A volume table of a particular species is defined as a table showing the average volume of trees, logs or sawntimber for one or more given characteristics such as DBH alone or DBH and height or DBH, height and form or taper. The main objective of volume tables is to facilitate estimating the average volume of standing trees for which the diameter and height are known. The volume is based on the actual volume measurements of some 40 to 50 felled or standing trees of all diameter classes. It is based on the assumption that individuals of the same species, with the same DBH, or DBH and height have, on average, the same volume (given identical growing conditions). Thus, volume tables can be classified into three categories according to the number of independent variables (one to three) i.e. DBH, height and/or taper.

Volume equations

The development of a volume table requires volume equations for the species in question. There are three types of volume equations based on the number of variables and objectives. Each type is formulated by means of regression analysis:

  1. Local volume equation: Local volume equations are applicable for a small forest or land area and are based on only one variable, i.e. DBH.

    The basic assumption is that trees of a given species, at a given location, with the same DBH, will have the same height and form. This assumption is only valid as long as site conditions are homogenous.

  2. Regional volume equation: This type of equation is normally based on two variables (e.g. DBH and height) and covers a larger geographical area. Regional volume equations are standard volume equations with limited application. Care needs to be taken that the trees measured, for the formulation of this equation, are truly representative of the variation encountered in the region.

  3. General or standard volume equation: This is an even broader equation and covers the full distribution of the species. It is normally based on two variables such as DBH and height.

A local volume equation can be easily prepared from a standard or regional volume equation by analysing the DBH/height relationship of the species for the given location.

Preparation of volume tables

There are two methods available to generate volume tables namely, the destructive and the non-destructive method.

Destructive method

In this method, 40-50 individuals of a particular species, representing all diameter classes of interest are selected randomly and felled. Each tree is cut into appropriate lengths of logs, generally between 2-3 m. The volume of each log is calculated individually, using suitable formulae, generally Huber’s formula for parabolides, cylindrical, conical or Newton’s formula for neiloidic form. The volume of each individual log is added to obtain the total volume of the tree.

Non-destructive method

This is similar to the destructive method but the trees are not felled. Diameters are measured at different heights by climbing the trees. Tree height is estimated with the help of e.g. an altimeter, a clinometer, a cruiser stick or a relaskop. The volume is then calculated using the same formulae as above. Volume tables can be prepared for particular species, on the basis of these calculations.

Data collection for preparation of volume tables

The trees to be measured are selected randomly. The DBH is measured twice to the nearest millimeter, perpendicular to each other, over bark. Both the height and the diameter are recorded in a table. After the measurements have been taken, the trees are felled. The first log is marked at 2.74 m (with the DBH in the centre) and the DBH taken as the girth. The rest of the bole is divided into sections of 3 m length and mid girth of each section is recorded at the middle of the log. The last section is allowed to vary between 2 to 4 meters. The lowest diameter limit fixed for the measurement is generally 5 cm. Similar measurements are carried out for all the branches.

Volume computation

The volume of individual logs is calculated using Huber’s formula, which considers the cross sectional areas of the log at mid-point as a circle. Multiplied with the length of the log it provides the volume.

V = sm x l

V = volume (m3)

sm = the sectional area at the middle (m2)

l = the length of the log or height of the log (m)

Earlier methods of developing volume tables involved large-scale data collection for different diameter and height classes. However, the present trend is to use multiple regression methods in which basal area, girth or DBH along with height or a form factor is taken into consideration. Although these methods have certain inherent limitations, they provide a high degree of correlation and statistically acceptable relationships.

General volume equations

General volume equations (GVEs), i.e. regression functions in volume, diameter and height are selected for each species. The GVEs are obtained from randomly selected tree data by applying multiple regression methods. The following regression equations are generally used:

  1. V = a + bD2H

  2. V = a + bD + cD2H

  3. V = a + bD2 + c(D2H) 2

  4. V = a + bD + cD2H + d(D2H) 2

  5. V = a + bD + cH + dD2H

  6. V = a + bD + cD2+ dD2H

  7. loge V = a + b loge D + c loge H

  8. V/D2H = a + bD2H

  9. V/D2H = a + bD2H + c/D2H

Where,  V = volume under bark (m3)
 D = diameter at breast height (1.37 m) over bark (m)
  (Unless otherwise specified)
 H = height of tree (m)
  a is the intercept and b, c & d are regression coefficients

The best fit regression equation is used to estimate the volume of trees.

Local volume equations

Local volume equations (LVEs) are developed with only one independent variable, i.e. diameter (D). The following types of regression equations are used to obtain LVEs:

  1. V = a + bD2

  2. V = a + bD + cD2

  3. V = a + bD + cD2 + dD3

  4. V = a + bÖ D + c D2

  5. V = a + bD

  6. Ö V = a + bD + cÖ D

  7. V/D2 = a + b/D2

  8. V/D2 = a + b/D + c/D2

  9. V/D2 = a + b/D2 + c/D + dD

  10. loge V = a + loge D

Where,  V = volume under bark (m3)
 D = diameter at breast height (1.37 m) over bark (m)
  (Unless otherwise specified)
  a is the intercept and b, c & d are regression coefficients

The best fit regression equation is used to estimate the volume of trees.

On the basis of developed volume equations volume tables can be prepared. An example of a volume table for some species is given below:

Local volume table for Jalgaon district

SL. NO.

Name of species

Diameter class (in cm)

10-20

20-30

30-40

40-50

50-60

60-70

70 +

1

Acacia arabica

0.110

0.410

0.900

1.590

2.450

3.460

4.620

2

Acacia catechu

0.084

0.319

0.671

1.141

1.729

2.433

3.256

3

Acacia leucophloea

0.065

0.278

0.639

1.149

1.807

2.614

3.569

4

Albizzia spp.

0.100

0.540

0.980

1.420

2.380

3.530

5.060

5

Azadirachta indica

0.067

0.219

0.500

0.910

1.448

2.116

2.913

6

Dalbergia latifolia

0.088

0.350

0.784

1.392

2.173

3.128

4.255

7

Dalbergia sissoo

0.088

0.350

0.784

1.392

2.173

3.128

4.255

8

Mangifera indica

0.100

0.530

0.970

1.590

2.550

3.450

5.060

9

Melia azadirachta

0.085

0.298

0.618

1.044

1.577

2.217

2.963

10

Mitragyna parviflora

0.065

0.294

0.725

1.357

2.192

3.228

4.465

11

Pongamia pinnata

0.065

0.278

0.639

1.149

1.807

2.614

3.569

12

Syzygium cumini

0.075

0.268

0.585

1.027

1.593

2.284

3.099

13

Tamarindus indica

0.067

0.219

0.500

0.910

1.448

2.116

2.913

14

Leucanea leucocephala

0.065

0.278

0.639

1.149

1.807

2.614

3.569

15

Other spp.

0.065

0.278

0.639

1.149

1.807

2.614

3.569

Note: 1. Volume figures are in m3.
 2. Volume figures are estimated using the mid-point of the diameter classes.

Previous PageTop Of PageNext Page