Estimation procedure for rural TOF
To estimate number of trees and growing stock, the ratio estimate is applied using the following formula.
| Let | n = number of sample villages in the stratum/state |
| N = total number of villages in the stratum/state |
| xi = area of ith sample village |
| yi = volume/no. of trees for the ith village |
 | = Average area of village in the sample |
 | = Average volume/no. of trees in the sample |
 | = Average area of village in the population (stratum/state) |
 | = Average volume/no. of trees in the population (stratum/state) |
Then the mean volume/no. of trees per unit area for the population (stratum/state) say, R is given by
 | = Total area of all villages in the population (stratum/state) |
The estimate of R is the sample ratio.
The estimate of total volume/no. of trees say,  in the population is given by the formula
Estimated variance of  is given by the formula
When N is large, then
Estimated variance of  is given by
S.E. of  | | S.E.%  |
S.E. of  | | S.E.%  |
Data processing
Data processing consists of two steps namely, data preparation and electronic processing.
Data preparation
The inventory data are collected by the field crew in the requisite forms (see Chapter III). The forms are precoded so that the data can be transferred directly to the data files.
The forms are prepared for processing as follows:
- The field forms are received by the Data Processing
Unit (DPU) and proper documentation is done for future reference.
- Data coding is done in the field forms, if omitted for
some reason earlier.
- The field forms are checked with the listing supplied
by the Field Operation Unit (FOU) for inconsistencies and coding mistakes.
- Abstract of field forms of TOF area is mentioned in
the register at DPU under the headings of: district geographical area, TOF
area, name of village, Sl. No. of sample village, geographical area of sample
village, mapsheet No., total No. of trees enumerated etc.
- Finally, data are corrected for input into the computer.
Electronic data processing
Data processing involves the following steps:
- Data entry: after consistency checking, data are
entered in FoxPro/Excel/Access for each tree in the data sheet, with its
species, diameter and category code. Data are entered village by village, with
identification particulars.
- Listings are taken out for the data entered in the
computer and checked to ensure complete loading and proper sequence. Necessary
corrections are incorporated in the data entered.
- Species and diameter class-wise volume tables are
prepared (see Chapter IV). In the case used as an example in this manual, the
local volume equations were developed by FSI. The volume table thus prepared
is used to calculate the volume of each tree.
- Compilation of data: data entry of all the villages,
which has already been done for a particular stratum are grouped in one file
for further processing.
- Classification of species: the species occurring more
than 1 percent, which are required for calculating the number of stems and
growing stock, are classified according to their category and diameter class.
Species with lower frequencies are grouped under other species and classified
in the same manner. This classification is done with the help of a routine in
FoxPro/Excel/Access.
- Category-wise tables: after selecting the main species
including other species, tables for enumerated trees are prepared in Excel and
filled in the following sample format for further processing.
Category: Distribution of enumerated trees by species and diameter class
|
Sl.
No. |
Species |
Diameter class |
Total |
|
10-20 |
20-30 |
30-40 |
40-50 |
50-60 |
60-70 |
70+ |
| |
|
|
|
|
|
|
|
|
|
| |
|
|
|
|
|
|
|
|
|
|
Total
|
|
|
|
|
|
|
|
|
Calculation of growth stock tables: The growth stock
tables are calculated per species and diameter class, for each category, by
multiplying the respective cells of the volume table, (see step 3 and category
table above).
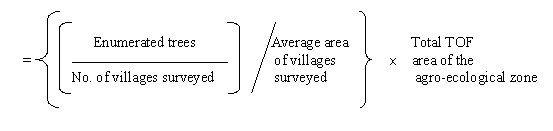
The number of trees and growing stock are adopted for all the villages of the stratum, i.e. agro-ecological zone. The following formula of the ratio estimator is used to estimate the number of trees and growing stock for the stratum:
Estimated number of trees =

TOF area of district is calculated according to formula:
TOF area = Total geographical area of district – forest area – urban area
Total TOF(R) Area for stratum = total of all such districts falling in the stratum
After that, the estimate for the population is generated with the help of stratum estimates.
The formats of reporting tables are given below:
Table 1. Distribution of estimated total no. of stems by species and diameter class
|
Sl.
No. |
Species |
Diameter class |
Total |
% of trees |
Stem/ha |
|
10-20 |
20-30 |
30-40 |
40-50 |
50-60 |
60-70 |
70+ |
| |
|
|
|
|
|
|
|
|
|
|
|
| |
|
|
|
|
|
|
|
|
|
|
|
| |
Total |
|
|
|
|
|
|
|
|
|
|
| |
% of trees |
|
|
|
|
|
|
|
|
|
|
| |
Stem/ha |
|
|
|
|
|
|
|
|
|
|
Table 2. Distribution of estimated volume by species and diameter class
|
Sl.
No. |
Species |
Diameter class |
Total |
% of vol. |
Vol/ha |
|
10-20 |
20-30 |
30-40 |
40-50 |
50-60 |
60-70 |
70+ |
| |
|
|
|
|
|
|
|
|
|
|
|
| |
|
|
|
|
|
|
|
|
|
|
|
| |
Total |
|
|
|
|
|
|
|
|
|
|
| |
% of vol. |
|
|
|
|
|
|
|
|
|
|
| |
Vol/ha |
|
|
|
|
|
|
|
|
|
|
Table 3. Distribution of estimated total no. of stems by category and diameter class
|
Sl.
No. |
Category |
Diameter class |
Total |
% of stems |
Stem/ha |
|
10-20 |
20-30 |
30-40 |
40-50 |
50-60 |
60-70 |
70+ |
| |
1 |
|
|
|
|
|
|
|
|
|
|
| |
2 |
|
|
|
|
|
|
|
|
|
|
| |
3 |
|
|
|
|
|
|
|
|
|
|
| |
4 |
|
|
|
|
|
|
|
|
|
|
| |
5 |
|
|
|
|
|
|
|
|
|
|
| |
6 |
|
|
|
|
|
|
|
|
|
|
| |
7 |
|
|
|
|
|
|
|
|
|
|
| |
8 |
|
|
|
|
|
|
|
|
|
|
| |
Total |
|
|
|
|
|
|
|
|
|
|
| |
percent of stems |
|
|
|
|
|
|
|
|
|
|
| |
Stem/ha |
|
|
|
|
|
|
|
|
|
|
Table 4. Distribution of estimated volume by category and diameter class
|
Sl.
No. |
Category |
Diameter class |
Total |
% of vol. |
Vol./ha |
|
10-20 |
20-30 |
30-40 |
40-50 |
50-60 |
60-70 |
70+ |
| |
1 |
|
|
|
|
|
|
|
|
|
|
| |
2 |
|
|
|
|
|
|
|
|
|
|
| |
3 |
|
|
|
|
|
|
|
|
|
|
| |
4 |
|
|
|
|
|
|
|
|
|
|
| |
5 |
|
|
|
|
|
|
|
|
|
|
| |
6 |
|
|
|
|
|
|
|
|
|
|
| |
7 |
|
|
|
|
|
|
|
|
|
|
| |
8 |
|
|
|
|
|
|
|
|
|
|
| |
Total |
|
|
|
|
|
|
|
|
|
|
| |
% of vol. |
|
|
|
|
|
|
|
|
|
|
| |
Vol./ha |
|
|
|
|
|
|
|
|
|
|
Table 5. Distribution of estimated total no. of stems by species and category
|
Sl.
No. |
Species |
Category |
Total |
% of trees |
Stem/ha |
| |
1 |
2 |
3 |
4 |
5 |
6 |
7 |
8 |
| |
|
|
|
|
|
|
|
|
|
|
|
|
| |
|
|
|
|
|
|
|
|
|
|
|
|
| |
Total |
|
|
|
|
|
|
|
|
|
|
|
| |
% of trees |
|
|
|
|
|
|
|
|
|
|
|
| |
Stem/ha |
|
|
|
|
|
|
|
|
|
|
|
Table 6. Distribution of estimated volume by species and category
|
Sl.
No. |
Species |
Category |
Total |
% of vol. |
Vol/ha |
| |
1 |
2 |
3 |
4 |
5 |
6 |
7 |
8 |
| |
|
|
|
|
|
|
|
|
|
|
|
|
| |
|
|
|
|
|
|
|
|
|
|
|
|
| |
Total |
|
|
|
|
|
|
|
|
|
|
|
| |
% of vol. |
|
|
|
|
|
|
|
|
|
|
|
| |
Vol/ha |
|
|
|
|
|
|
|
|
|
|
|
In all the tables above, the estimated number of trees and volume, the values in each diameter class or category is obtained by adding corresponding values obtained during processing. After this, the percentage and per hectare figures are calculated. Similar calculations are done in case of urban TOF taking class of town as strata, block as sample unit and district as population. Using the above mentioned formula in estimation procedure, the standard error is calculated for the estimates of number of stems and volume of TOF area of the state.
Data processing tools
In a typical census, a large amount of data has to be entered, but the data structure and statistical tabulations are relatively simple, comprising first-level tabulations and second- and third-level cross-tabulations. In contrast, sample surveys require far less data input (10 percent or, more generally, 5 percent or less), but the statistical operations, such as the estimation of population totals and their variance are complex.
Computers have now become an indispensable tool for data processing in the public and private sector. Almost invariably, survey data are now processed on personal computers (PC). For example, the data of 48 Demographic and Health Surveys, conducted in different countries of the world during 1985 and 1992, were all processed on PCs, using an integrated software package especially developed for these surveys. The first sets of tabulations was completed within two weeks of the receipt of data.
Large-scale surveys are conducted by government organizations, industry, political organizations and large private-sector enterprises. They generally have the same objective in selecting sampling designs, which is to minimize the variance of survey estimates under the constraints of time and cost. As a consequence, most large-scale surveys are characterized by sampling designs with varying degrees of complexity. They often include features like stratification, disproportionate sampling, multiple stages of sample selection, clustering, PROC SURVEYSELECT (PPS) sampling and similar procedures. They often use different estimators like ratio and regression estimators. Most standard statistical software packages such as SAS, SPSS, S-Plus and SysStat assume that the data were obtained from a simple random sample in which the observations are independent and identically distributed and selected with equal probability. When the data have been collected using a complex sampling design, variance estimates of survey statistics desired under simple random sampling assumptions generally underestimate the true variance, which results in artificially lower confidence intervals. Therefore, when using a standard statistical package, care should be taken and limitations of the software be covered by utilizing appropriate weights, as per sampling design using different commands. Generally, integrated software packages are developed for data processing of these large surveys and standard statistical packages are used for data analysis purposes.


