The adequacy of inflow within a prescribed limit of time in a given area of fishpond depends largely in the proper determination of the width of sluice gate. The gate may be a main gate or a secondary gate in the fish farm. In calculating for the width of a main gate, the total area of ponds to be served is considered as one large pond with an area equal to the sum of the areas of the ponds in the system.
The width of sluice gate can be determined by repetitive computation procedure. The general principle is to assume a width, B, for the gate. Necessary calculations is carried out using the assumed width to compare if it would be able to provide the designed water depth or level in the pond within the specified time. If it is found that water cannot be filled to the level desired within the specified time, another width is assumed and the process of calculation is repeated until the right size is obtained. Through experience, two or three calculations may be needed.
Katoh (1980) describes a guide in determining the width of sluice gate as follows:
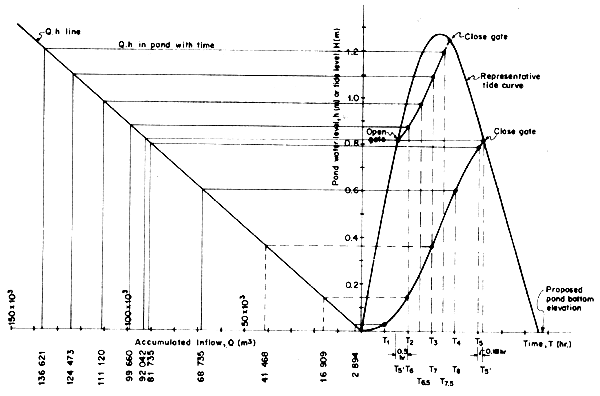
(a) The design tide curve as determined in the previous section is drawn together with the graph for the rate of inflow and water level in the pond. The design tide curve is plotted at the right side of the graph while the latter at the left (Fig. B.1). The X-axis on the right graph defines the elevation of the pond bottom while on the left the accumulated flow, Q.
(b) Next is the calculation of rate of flow, q, and accumulated flow, Q, and resulting depth of water in pond, h, at specified time interval, usually one hour, 30 minutes or even less. Tidal flow changes with time. This is referred to technically as “unsteady flow”.
The calculation of the rate of flow, q, is done at one hour interval in order to satisfy the assumption that the difference between pond depth and outer sea level is free from fluctuation during the one-hour interval. Hence, more accurate result is obtained if narrower interval than one-hour is used.
(c) The computation of rate of flow, q, passing through a sluice distinguishes two kinds of flow — the supercritical or jet flow, and the subcritical or ordinary flow. Within a given time in a tidal cycle, the nature of flow passing through a sluice may change from supercritical to subcritical. Jet flow is characterized by swift velocity of water through the sluice while ordinary flow has slow velocity. The current of water passing through the sluice initially is fast and is a jet flow. As the depth of water in the pond increases, the velocity of water entering the pond slows down. Hence, the jet flow changes to subcritical or ordinary flow.
To identify or distinguish the condition of flow, one of the criteria used is the depth of water which is as follows:
Subcritical flow if the pond water depth, h, is
greater than ![]() of the mean value of tide level,
H, within any one hour interval. In symbol:
of the mean value of tide level,
H, within any one hour interval. In symbol:

Supercritical flow if the pond water depth, h,
is less than ![]() of mean value of tide level, H,
within any one hour. In symbol:
of mean value of tide level, H,
within any one hour. In symbol:

(d) The rate of flow can then be computed as follows:
(i) For subcritical flow:
 | |
| Where: | g = gravitational acceleration equal to 9.8 m/sec2 |
| B = width of sluice in meter | |
| T = time in seconds | |
| u' = 1 |
(ii) For supercritical flow, u = 0.91 (Katoh, 1980)
| q = 1.7 u BH1.5 | or q = 1.55 BH1.5 |
| Q = 1.7 u BH1.5.T | or Q = 1.55 BTH1.5 |
(e) A numerical example is as follows:
Given conditions:
Pond area — 11 units at 1.0318 ha each or total of 11.35 ha.
Required water level or depth at the pond for farming shrimp is minimum of 1.0 m.
Allowance for losses during filling is 20 percent.
Sluice gate should at most fill the ponds for three consecutive high water or spring tides.
Solution: The values used in the computation and the estimates obtained are summarized and plotted in Table B and Fig. B.1, respectively.
Table B.1
Values used in tide curve and estimates of water level in the pond of example problem
| Time | Outside tide level, H (from tide curve) (m) | Pond water level, h (m) | Inflow, Q (m3) | |||
|---|---|---|---|---|---|---|
| From | To | Interval (sec) | ||||
| T0 | 0 | 0 | 0 | |||
| T0 | T1 | 3 600 | 0.550 | 0.025 | 2 894 | |
| T1 | T2 | 3 600 | 0.025 | 0.149 | 16 909 | |
| T2 | T3 | 3 600 | 1.265 | 0.365 | 41 468 | |
| T3 | T4 | 3 600 | 1.190 | 0.606 | 68 735 | |
| T4 | T5 | 3 600 | 0.885 | 0.792 | 81 735 | |
| T5 | T5 | 684 | 0.820 | -- gate closed -- | 0.810 | 92 042 |
| T | 0.550 | receding tide | ||||
| 0.275 | level after | |||||
| 0 | closing of gate | |||||
| T5 | T6 | 1 800 | 0.810 | |||
| T6 | T6.5 | 1 800 | 1.025 | 0.878 | 99 660 | |
| T6.5 | T7 | 1 800 | 1.145 | 0.979 | 111 120 | |
| T7 | T7.5 | 1 800 | 1.265 | -- gate closed -- | 1.097 | 124 473 |
| 1.2275 | 1.200 | 136 621 | ||||

Fig. B.1 Change on pond water level with time as plotted against the tide curve for a given width of sluice gate
(After Katoh's method, 1980; data used by Hechanava and Tiensongrusmee, 1980)
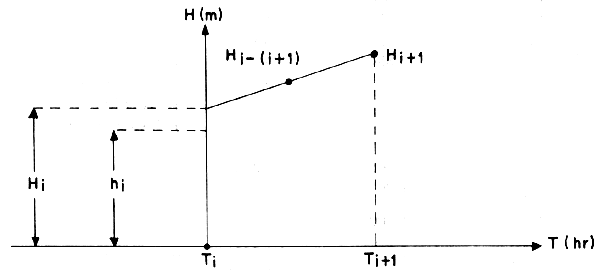
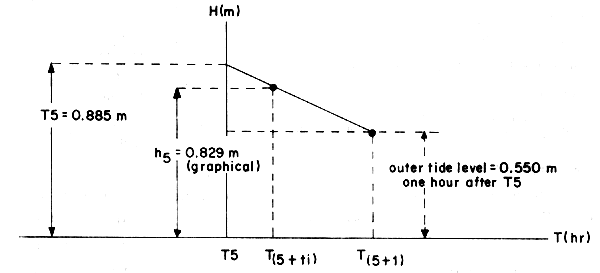
Calculation is made at intervals of one hour for super-critical flow condition and 30 minutes when the flow has changed to subcritical. The difference between the rising and falling tide levels, and the average depth of pond water at any time interval is illustrated in Figures B.2 and B.3.
1. From To to Ti:
(i) The difference, d, between outer tide level H and pond water level h is
| dl | = ½ (Ho + Hi) - Ho |
| = ½ (0 + 0.55) - 0 = 0.275 m |

Fig. B.2 A segment of rising tide level, H, during any one hour interval and its difference with pond water level, h.
Where:
H = tide level (m)
h = water level or depth in pond (m); Hi water level
in pond at any instant
H = mean value of tide level (m)
Hi-(i+1)=estimate of H for one hour during time
between T and T(i+1)
(ii) Check for supercritical or subcritical flow

Therefore the flow is supercritical or jet flow
(iii) Rate of flow q and inflow for one hour in the pond
| q0–1 | = 1.70 uBH1.5 B = 3.60 m (3 openings at 1.20 m) |
| = 1.70 × 0.91 × 0.2751.5 × 3.60 = 5.5692 × 0.2751.5 | |
| = 0.804 m3/sec |
The total volume of flow for one hour interval or 3 600 seconds is
Q0–1 = 0.804 × 3 600 sec/hr = 2 894.4 m3
(iv) Pond water level, hi:

(v) Mean velocity of water

V0–1 = 0.812 m/sec
The accumulated flow, Q, for one hour, passing through the sluice into the pond is 2 894.4 m3. This value is plotted as Q1, on the horizontal-axis of the left quadrant (Fig. B.1). A perpendicular is drawn from the Q1 axis to intersect the diagonal Q-h line and from this point of intersection, a horizontal line is drawn to intersect the vertical axis at h = 0.025 m. This horizontal line is extended to the right quadrant to further intersect the vertical projection of Ti.
2. T1 - T2 (reads from T1 to T2):
(i) d2 = ½ (H1 + H2) - h1 = ½ (0.550 + 1.025) - 0.025 = 0.763 m
(ii) Condition of flow

Therefore, flow is supercritical
(iii) Rate of flow and inflow for one hour
| q1–2 | = 5.5692 H1.5 = 5.5692 × 0.78751.5 = 5.5692 × 0.699 |
| = 3.893 m3 sec | |
| Q1–2 | = 3.893 × 3 600 = 14 014.8 m3 |
(iv) Accumulated inflow and pond water level
| Q0–2 | = Q0–1 + Q1–2 |
| = 2 894.4 + 14 014.8 = 16 909.2 m3 |


(v) Mean velocity

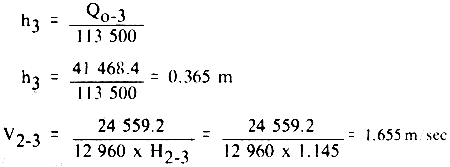
3. T2 - T3:
(i) Difference in outer tide level and pond water level
| d3 | = ½ (H2 + H3) - h2 |
| = ½ (1.025 + 1.265) - 0.149 | |
| = 0.996 m |
(ii) Flow condition
h2 = 0.149 is less than  or 0.767, therefore
flow is supercritical
(iii) Rate of flow and inflow for one hour
| q2–3 | = 5.5692 × 1.1451.5 = 6.822 m3/sec |
| Q2–3 | = 6.822 × 3 600 sec/hr = 24 559.2 m3 |
(iv) Accumulated inflow and water level in the pond
| Q0–3 | = Q0–2 + Q2-3 |
| Q0–3 | = 16 909.2 + 24 559.2 = 41 468.4 m3 |

4. T3 - T4:
(i) Difference in outer tide level and pond water level
| d4 | = ½ (H3 + H4) - h3 |
| = ½ (1.265 + 1.190) - 0.365 | |
| = 1.2275 - 0.365 = 0.8625 m |
(ii) Flow condition
h3 = 0.365, is less than  or 0.818
Flow is still supercritical
(iii) Flow rate and inflow for one hour
| q3–4 | = 5.5692 × 1.22751.5 = 7.574 m3/sec |
| Q3–4 | = 7.574 × 3 600 = 27 266.4 m3 |
(iv) Accumulated inflow and water level in the pond
| Q0–4 | = Q0–3 + Q3–4 |
| Q0–4 | = 41 468.4 + 27 266.4 = 68 734.8 |

(v) Mean velocity

5. T4 - T5:
| (i) | d5 | = ½ (H4 + H5) - h4 |
| = ½ (1.190 + 0.885) - 0.606 | ||
| = 1.0375 - 0.606 = 0.4315 |
(ii) Flow condition
h4 = 0.606 is less than  or 0.695
Still supercritical flow
(iii) Flow rate and inflow for one hour

Q4–5 = 5.887 × 3 600 = 21 191.9 m3
(iv) Accumulated inflow and water level in the pond
Q0–5 = Q0–4 + Q4–5 = 68 734.8 + 21 191.9 = 89 926.72 m3

(v) Mean velocity

6. T5 - T6:
| (i) | d6 | = ½ (H5 + H6) - h5 |
| = ½ (0.885 + 0.550) - 0.792 | ||
| = 0.7175 - 0.792 = 0.0745 m |
This means that the inflow in the pond ceases in less than one hour after T5. Hence, the need to calculate for time, t, after T5. The solution using the illustration for receding tidal flow (Fig. B.3) is as follows:
Using slope - intercept form of equation of a line:

= - 0.335 t + 0.885

Fig. B.3 The falling segment of tide curve
At T(5 + ti), H(5 + ti) is 0.820 m, and therefore
H(5 + ti) = 0.820 = -0.335 ti + 0.885

7. T5 - T5 (0.19 hr or 684 sec)
| (i) | d5 | = ½ (H5 + H5+ti) - h5 |
| = ½ (0.885 + 0.820) - 0.792 | ||
| = 0.852 - 0.792 = 0.060 m (Close gate to prevent outflow of pond water or tide level continues to recede for the day) |
(ii) Flow condition
h5 = 0.792, is greater than  or 0.570
Therefore, flow has changed from supercritical to sub-critical
(iii) Flow rate for subcritical flow and inflow for 0.19 hour

Q5-5' = 3.092 × 684 sec = 2 114.93 m3
(iv) Accumulated inflow and water level in the pond
Q0–5' = 89 926.72 + 2 114.93 = 92 041.65
 | 0.81 m (very close to value of 0.82 obtained by graphical method) |
(v) Mean velocity

8. T5' - T6 (the time difference between T5' - T6 is approximately 0.5 hr or 1800 sec.
(i) d6 = ½ (0.810 + 1.025) - 0.810 = 0.1075 m
(ii) Flow condition (this step may be omitted in subsequent computations. Once flow changed from supercritical to subcritical, it will remain as subcritical flow)
h5' = 0.81 m, is greater than  or 0.615
Therefore flow is subcritical
(iii) Flow rate and inflow for 0.5 hour

Q5'–6 = 4.233 × 1800 = 7 618.90 m3
(iv) Accumulated inflow and water level in pond
| Q0–6 | = 92 041.65 + 7 618.90 |
 |
(v) Mean velocity

The rate of flow varies greatly if the ratio of water level of pond and outer tide level (h/H) at subcritical flow slightly changes. Therefore, the time interval will be changed from one hour to 30 minutes, in order to reduce calculation errors.
9. T6 - T6.5
| (i) | d6.5 | = ½ [H6 + ½ (H6 + H7)] - h6 |
| = 0.5 [1.025 + 0.5 (1.265)] - 0.878 | ||
| = 1.085 - 0.878 = 0.207 m |
(ii) Flow condition
h6 = 0.878 m, is greater than 
Thus, flow is subcritical
(iii) Flow rate and inflow for 0.5 hour

= 6.367 m3/sec
Q6–6.5 = 6.367 × 1800 = 11 459.950 m3
(iv) Accumulated inflow and water level in pond
| Q0–6.5 | = 99 660.55 + 11 459.95 |
| = 111 120.50 m3 |

10. T6.5 - T7
| (i) | d7 | = ½ (½ H6 + H7) - h6.5 |
| = ½ (1.145 + 1.265) - 0.979 m | ||
| = 1.205 - 0.979 = 0.226 m |
(ii) Flow rate and inflow for 0.5 hour
| q6.5–7 |  |
| = 7.418 m3/sec | |
| Q6.5–7 | = 7.418 × 1800 |
| = 13 352.4 m3 |
(iii) Accumulated inflow and water level in pond
| Q0–7 | = 111 120.50 + 13 352.40 |
| = 124 472.90 m3 | |
| h7 |  |
11. T7 - T7.5
| (i) | d7.5 | = ½ [H7 + ½ (H7 + H8)] - h7 |
| = ½ [1.265 + 0.5 (1.265 + 1.19)] - 1.097 | ||
| = 1.246 - 1.097 | ||
| = 0.149 m |
(ii) Flow rate and inflow for 0.5 hour
| q7–7.5 |  |
| = 6.749 m3/sec | |
| Q7–7.5 | = 6.749 × 1800 |
| = 12 147.94 m3 |
(iii) Accumulated inflow and water level in pond
| Q0–7.5 | = 124 472.90 + 12 147.94 |
| = 136 620.84 m3 | |
| h7.5 |  |
From the calculation, the assumption of 3 openings at 1.20 m per opening can fill the entire area to a minimum depth of 1.0 m within two days only. If the maximum limit of filling time of three days is desired, then the assumption must be reduced and the same procedure in the calculation is made.